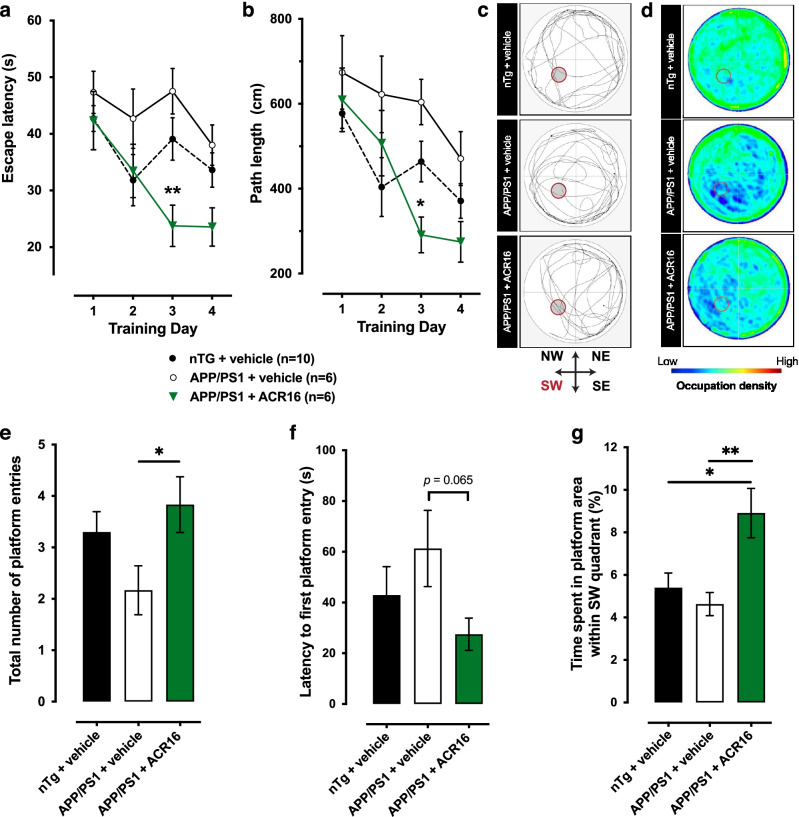
Fig. 6.
ACR16 reduces spatial memory deficits associated with the APP/PS1 transgenic model of AD. a Comparison of the average latency to discover the submerged platform for nTg mice (n = 10), saline-treated APP/PS1 mice (n = 6), and APP/PS1 mice treated with 1.5 mg/kg ACR16 (n = 6). Both nTg mice and APP/PS1 mice treated with ACR16 exhibit significant differences compared to saline treated APP/PS1 mice, in which less time was required to reach the submerged platform. b Average distance traveled to reach the platform. nTg mice and APP/PS1 treated with ACR16 used shorter paths to reach the platform than untreated APP/PS1 mice. A Sidak’s multiple comparisons test was performed after 2-way ANOVA in a and b, where significant differences as shown as *(p < 0.05) and **(p < 0.01). Probe test observations are provided as individual swimming paths in the MWM from a representative animal for each group (c) and as heat map for the activity of all subjects in each group overlayed onto each other in the MWM (d). Here, untreated APP/PS1 mice predominantly swam close to the edge of the pool in circular paths (d). Together with less presence in the SW quadrant and the inner part of the pool (blue color areas), these data suggest a great difficulty in remembering the former position of the platform (d). In contrast, nTg and ACR16 mice treated with APP/PS1 have a high presence in the central part of the pool and show a higher frequency of passage (green areas) through the area previously occupied by the platform (d and e). f In the probe test, ACR16-treated transgenic mice had shorter times to reach the platform for the first time compared to untreated transgenic mice and wild-type mice. g Similarly, to the number of entries, the same trend was observed when comparing the total time spent in the platform area between groups, where treated APP/PS1 mice spent more time in this area than the other groups. Data in e, f, and g are expressed as mean ± S.E.M and analyzed by a Student’s t-test. Significant differences are represented as *(p < 0.05) and **(p < 0.01)

