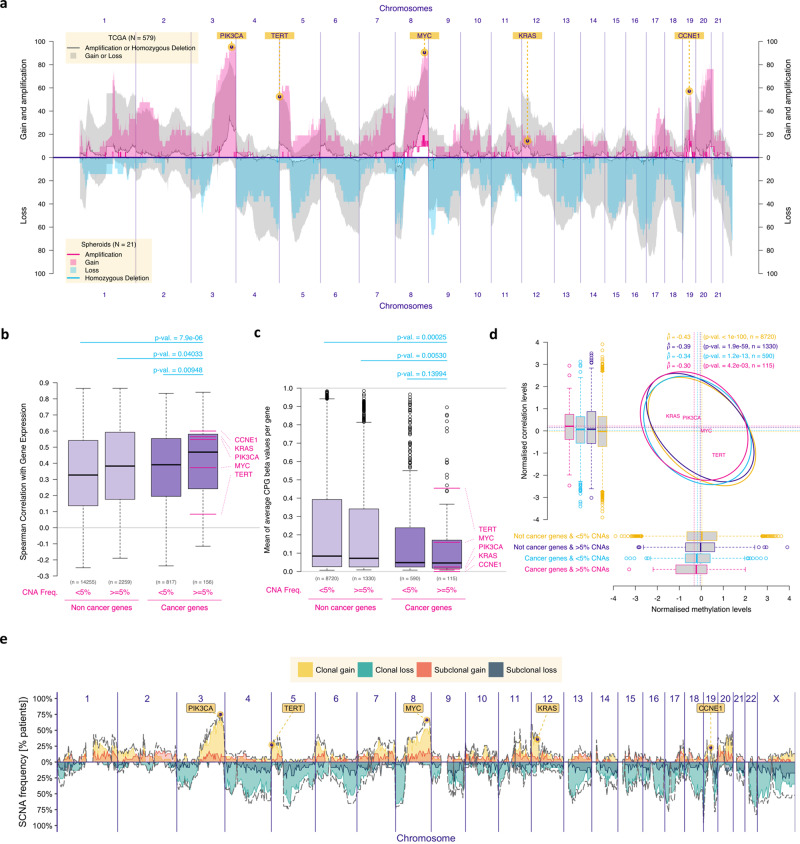
Fig. 2. Genomic analysis of single and multi-regional HGSOC cohorts defined clonal SCNA driver genes.
a Plot showing the prevalence of chromosomal alterations across the genome in both the TCGA cohort (n = 579) and in the HGSOC spheroid samples from the OV04 cohort (n = 21). For the spheroid cohort, gain was defined as 3 or 4 chromosomal adjusted copies and amplifications as ≥5 adjusted copies. b Boxplots showing the Spearman’s correlation scores between gene expression and respective chromosomal copy number for each gene, split between cancer vs non-cancer genes and prevalent (>5% SCNAs in HGSOC) vs non-prevalent genes. Driver genes (in the far right; defined as ‘cancer genes’ that have SCNA alteration frequency in ≥5% of the samples) had the highest positive correlation scores. Numbers above the boxplots correspond to the p-values obtained with two-sided Mann-Whitney-Wilcoxon tests. c Boxplots showing methylation levels (beta-values) for all genes, split as cancer and non-cancer genes and as prevalent (>5% SCNAs in HGSOC) and non-prevalent genes. Prevalent non-cancer genes were significantly more methylated than prevalent cancer genes (two-sided Mann-Whitney-Wilcoxon’s p-value: 0.005). d 95% prediction confidence ellipses displaying the estimated Pearson’s correlation between the methylation levels (x-axis, normalized) and the correlation between chromosomal copy number and gene expression (y-axis, normalized) for four groups of genes defined as combinations of cancer and non-cancer genes and as prevalent and non-prevalent genes. The boxplots respectively report the same information as the ones of panels b (vertical boxplots) and c (horizontal boxplots) on the normalized scale. For each group, Pearson’s correlation estimate, p-value of the two-sided test of association between paired samples and number of genes are indicated (top right); for panels b, c and d, n = 371 independent TCGA samples, inference without multiplicity correction, and for all boxplots, the central box was defined by the quantiles 0.25, 0.5 and 0.75 of the data, and the wiskers as 1.5 times of the interquartile range. e Frequency of somatic clonal and subclonal copy number alterations across the genome of 72 tumour regions from 28 HGSOC primary tumours. Gains and losses were classified relative to ploidy (Supplementary Fig. S1b shows the genomic distribution of the frequency of somatic copy number alterations across 127 tumour regions of primary tumours and metastases from 30 HGSOC patients). The dotted line corresponds to the total number of gains and losses (clonal and subclonal).

