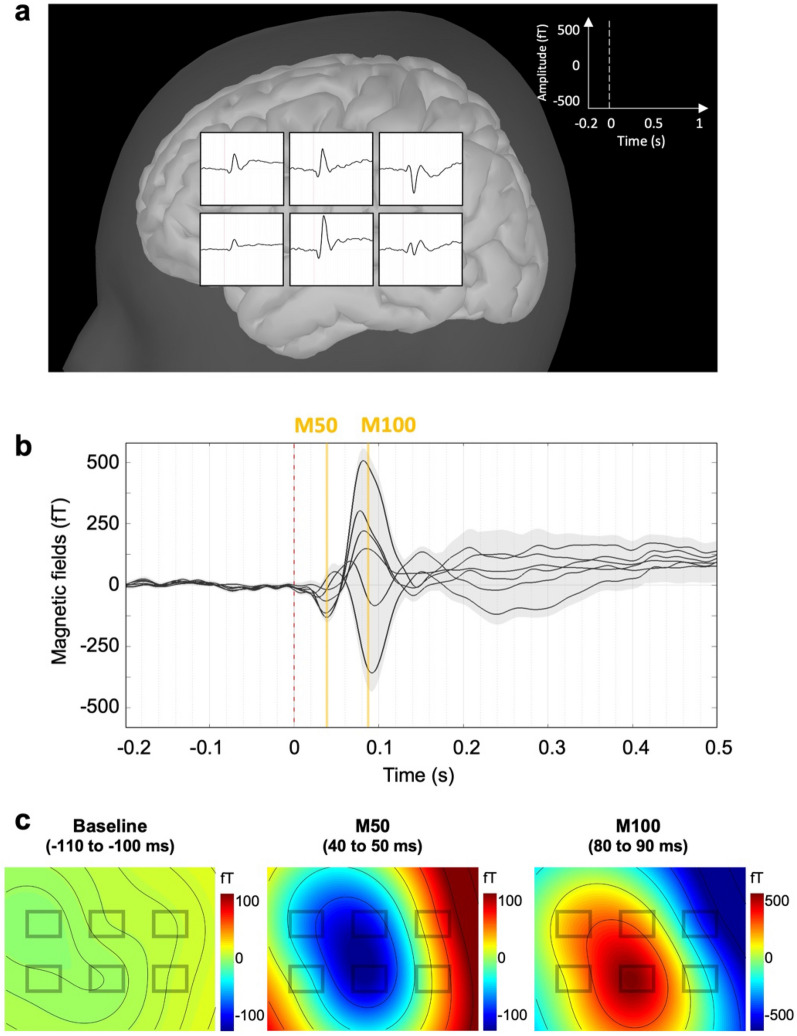
Figure 2.
Auditory-evoked fields and their topographical distributions recorded by OPM sensors during auditory pure-tone bursts. (a) Grand-average auditory-evoked field of 22 participants measured by each OPM sensor. (b) M50 component observed at approximately 43 ms (42.91 ± 6.12 ms) and M100 component observed at approximately 86 ms (86.27 ± 7.34 ms). A light-grey area represents the standard error across all participants. (c) Topographical maps representing the field distributions of the baseline (− 110 to − 100 ms according to the onset of the auditory pure-tone burst), M50 component (40–50 ms), and M100 component (80–90 ms).

