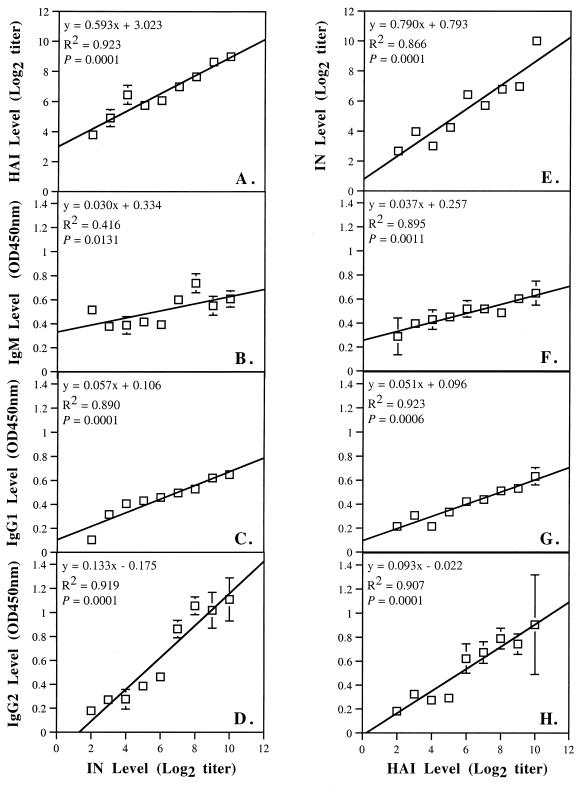
FIG. 2.
Correlation of serum IN antibody level versus levels of HAI antibody (A), IgM (B), IgG1 (C), and IgG2 (D) in serum and serum HAI antibody level versus levels of serum IN antibody (E), IgM (F), IgG1 (G), and IgG2 (H) in serum. The mean ± SEM (error bars) for 33, 12, 11, 28, 30, 29, 14, 8, and 6 serum samples are shown for base 2 logarithms of IN antibody titers of 2, 3, 4, 5, 6, 7, 8, 9, and 10, respectively in panels A, B, C, and D. The means ± SEM (error bars) for 6, 26, 18, 24, 16, 24, 29, 26, and 2 serum samples are shown for base 2 logarithms of HAI antibody titers of 2, 3, 4, 5, 6, 7, 8, 9, and 10, respectively in panels E, F, G, and H.

