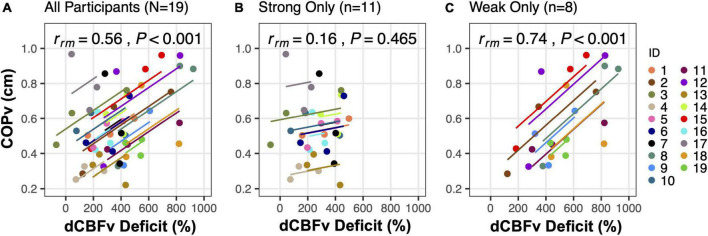
FIGURE 8.
Postural sway response to cerebral hypoperfusion. Repeated measures within-participant correlations between diastolic cerebral blood flow velocity deficit (dCBFv, quantified as the difference between dCBFv in the middle cerebral artery following the supine-stand transition and its baseline value in the supine posture before any intervention) and mean center of pressure vector (COPv) are shown. Analyses were performed among (A) all participants, and groups of (B) strong regulators only, or (C) weak regulators only, as identified through an a posteriori cluster analysis (112). The number of participants (n) included in each condition are shown at the top of each respective plot. Parallel slopes are fitted for each participant with ANCOVA using data from the 3 postural transitions, such that the overall model error is minimized. The repeated measures correlation coefficient (rrm) is derived from a ratio of the sum of squares. Adapted from Fitzgibbon-Collins et al. (112).

