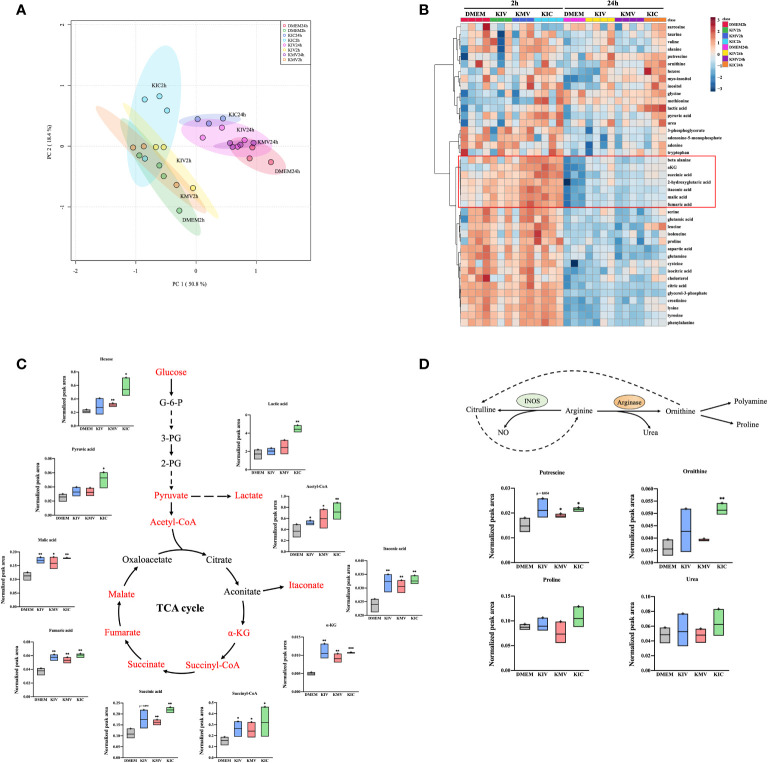
Figure 4.
BCKAs stimulation enhance TCA cycle and polyamine metabolism in macrophages. (A), PCA analysis of total identified metabolites among DMEM, KIV, KMV and KIC treatment at two time points (2 h and 24 h) is shown. (B), The hierarchal clustering heatmap of identified metabolites upon DMEM and three BCKAs treatment at two time points (2 h and 24 h) is shown. The rows indicate different metabolites, and the columns indicate different conditions. The log-transformed metabolite intensities (normalized to internal standards) were scaled by autoscaling (mean-centering/standard deviation). (C), Schematic representation of the TCA cycle, the corresponding metabolite is shown. (D), Schematic representation of the arginine metabolism at 24 h, the corresponding metabolites from (B) are shown. PCA (A) and hierarchical clustering (B) analysis were applied via online tool MetaboAnalyst. Data shown the mean ± SEM of n = 3 or 4 biological experiments. *p< 0.05, **p < 0.01, ***p < 0.001 (unpaired two-tailed t test) (unpaired two-tailed t test).

