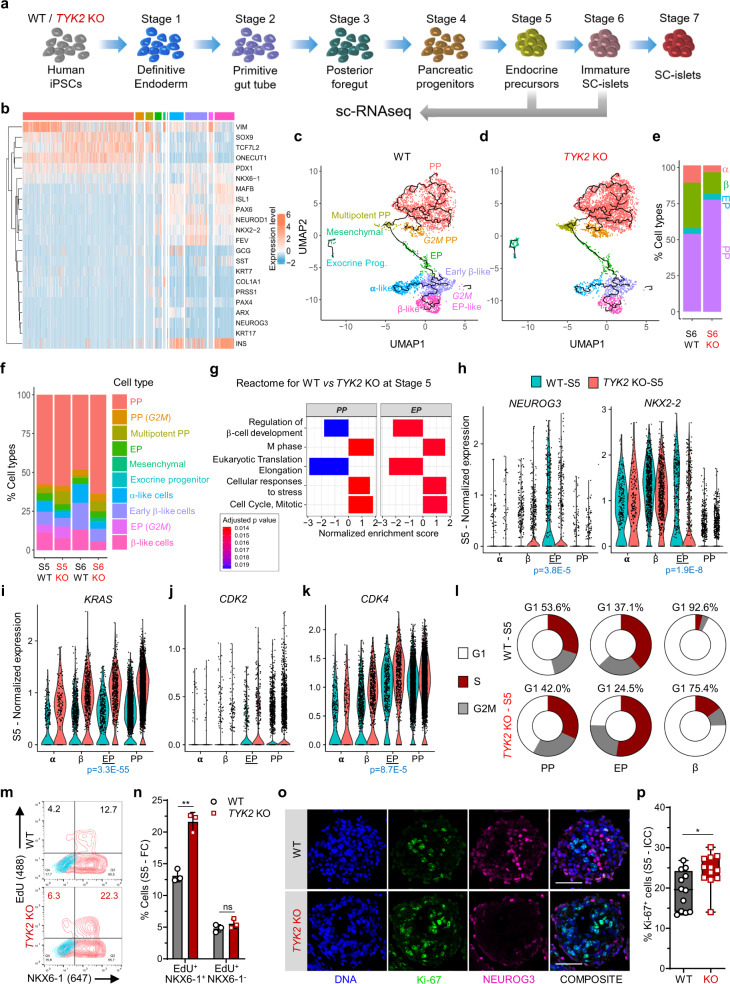
Fig. 4. Single-cell transcriptomic analysis of endocrine differentiation.
a Schematic for the scRNA-seq performed at Stage (S) 5 (3995 WT and 5025 KO -cells) and S6 (3348 WT and 4550 KO cells) samples. The figure was partly generated using Servier Medical Art, provided by Servier. b Heatmap for the selected genes associated with pancreatic differentiation. c Various noted clusters are indicated in different colour codes and presented as UMAP with pseudotime trajectories for S6 WT, d TYK2 KO and e relative percentages abundance of pancreatic progenitors (PP), endocrine precursors (EP), β-like cells (β), and α-like cells (α). f Relative abundance of all noted clusters in S5 and S6 for WT and TYK2 KO samples indicated in different colour codes. g Selected enriched pathways in S5 PP and EP like clusters using Gene set enrichment analysis (GSEA, Reactome). h Violin plots for the relative expression of NEUROG3 and NKX2-2; i KRAS, j CDK2, k CDK4 in indicated α, β, EP, and PP like clusters. l Donut chart showing the percentage of cells at various cell cycle phases with Seurat (CellCycleScoring) pipeline in PP, EP, and β-like cells clusters. m Flow cytometry analysis for NKX6-1+EdU+ cells during S5 and n their quantification (n = 3). Data are means ± S.D. o Immunocytochemistry for NEUROG3 and Ki-67 expression at S5. Scale bar = 100 μm. p Quantification of the data in panel o presented from two experiments with six images each (n = 12). The box and whiskers plot showing the median with min to max whiskers. Two-tailed unpaired t-tests were performed to determine the significance levels for n and p. *p < 0.05; **p < 0.01; ns—non-significant. Source data are provided as a Source Data file.

