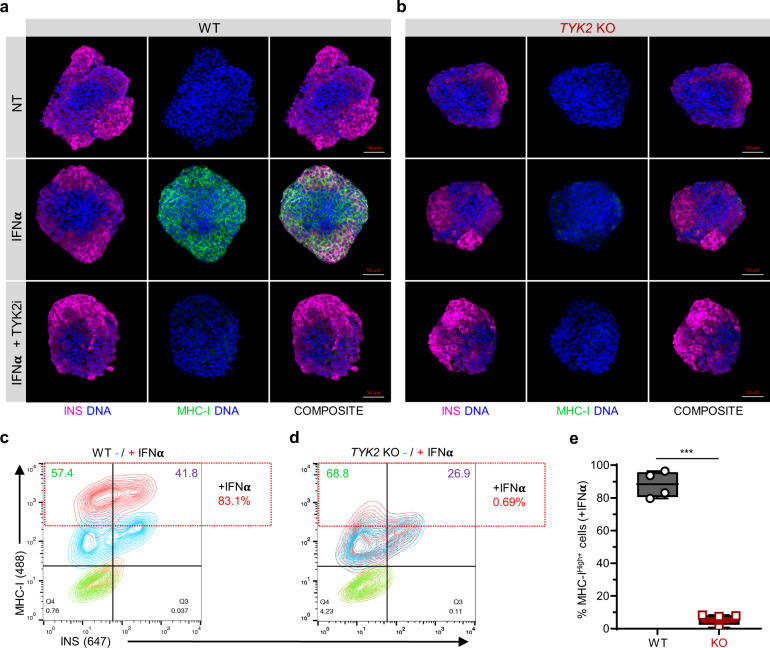
Fig. 6. TYK2 modulates MHC Class I presentation in SC-islets.
a, b Representative images of Stage 7 SC-islets showing the immunocytochemistry for insulin (red) and MHC Class Ι (green) expression following 24 h treatment with IFNα alone or in combination with TYK2i (n = 3). Panel a, WT cells; panel b, TYK2 KO cells. Scale bar = 50 μm. c, d Representative contour plots of flow cytometry showing the expression of insulin and MHC Class Ι following 24 h IFNα treatment. Panel c, WT cells; panel d, TYK2 KO cells. e Quantification of the data in c, d (n = 4). Two-tailed unpaired t-test was performed to determine the significance levels. Box and whiskers plot showing median with min to max whiskers. ***p < 0.001. Source data are provided as a Source Data file.

