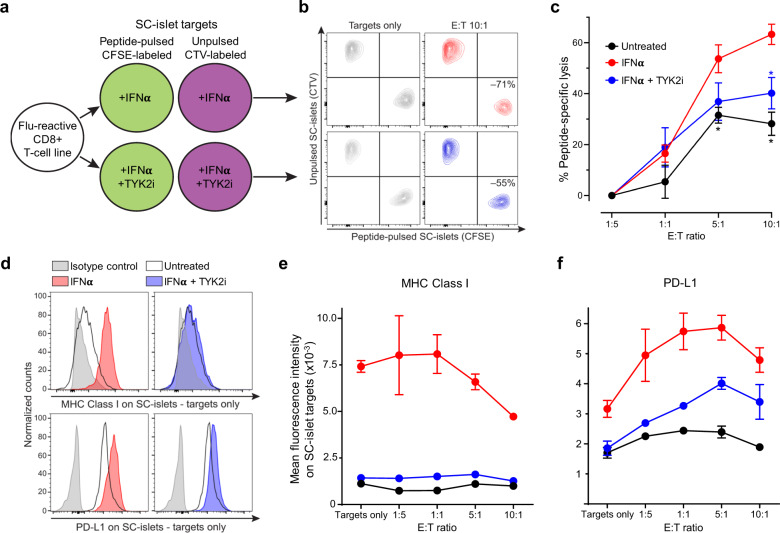
Fig. 7. TYK2 inhibition modulates T-cell-mediated cytotoxicity in SC-islets.
a Schematic of T-cell/SC-islet co-culture experiments. Increasing numbers of flu peptide-reactive CD8+ T cells were incubated for 6 h with a fixed mixture of peptide-pulsed, CFSE-labelled SC-islets and unpulsed, CellTrace Violet (CTV)-labelled SC-islets, which were preliminary treated for 24 h with IFNα alone or in combination with TYK2i or left untreated. The ratio of surviving (Live/Dead-negative) pulsed CFSE+ vs. unpulsed CTV+ SC-islets thus provided a readout of peptide-specific lysis. b Representative flow cytometry contour plots of IFNα-treated (top) and IFNα/TYK2i-treated SC-islets (bottom), cultured alone (left) or with T cells at an effector-to-target (E:T) ratio of 10:1 (right). Each population is gated on Live/Dead-negative events. The percent peptide-specific lysis in the presence of T cells (i.e., the ratio of CFSE+/CTV+ live cells normalized to the ratio in the absence of T cells) is indicated. c Peptide-specific lysis for the indicated conditions at different E:T ratios. Data are normalized means ± SEM of two experiments performed in triplicates: *p < 0.05 by two-tailed Mann–Whitney U test vs IFNα. d Representative flow cytometry histograms of MHC Class Ι (top) and PD-L1 expression (bottom) in SC-islet targets treated with IFNα (left) or IFNα/TYK2i (right). e, f Mean fluorescence intensity of e MHC Class Ι and f PD-L1 expression in SC-islets at different E:T ratios. Data are means ± SEM of duplicate wells and one representative experiment out of two performed is shown. Source data are provided as a Source Data file.

