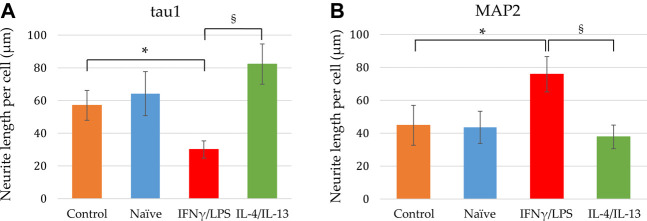
FIGURE 6.
Quantitative analysis of axonal and dendritic development of differentiating neuronal cells exposed to naïve and stimulated microglia. Using confocal images similar to that shown in Figures 4, 5, the tau1-positive (A) as well as MAP2-positive (B) neurite lengths per cell were calculated from the corresponding total neurite lengths and the cell numbers. Data are presented as mean ± SEM calculated from two biological parallels (each conditions include 1000–2500 cells). For statistical analysis, Mann-Whitney U test was performed. Asterisks indicate significant differences as compared to control (NPCs with no co-culturing), whereas section signs mark significant differences between neuronal cells co-cultured with pro- and anti-inflammatory stimulated microglia (p < 0.05).

