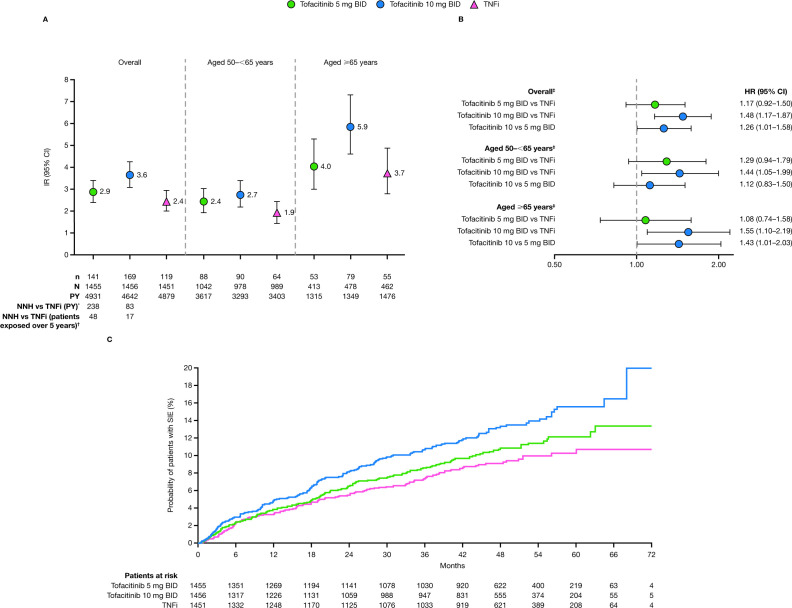
Figure 2.
(A) IRs (patients with first events/100 PY; 95% CIs) and (B) HRs (95% CIs) for SIEs, overall and stratified by age; and (C) cumulative probabilities of experiencing a first SIE (Kaplan-Meier method), in ORAL Surveillance. HRs are shown on a logarithmic scale. For patients randomised to the tofacitinib 10 mg two times per day group who had their dose of tofacitinib reduced to 5 mg two times per day, the data collected after patients were switched to tofacitinib 5 mg two times per day were counted in the tofacitinib 10 mg two times per day group. IRs and HRs for SIEs overall have been reported previously.13 *Number of PY of exposure to tofacitinib required to have one additional event, relative to a TNFi †Number of patients who would need to be treated over 5 years with tofacitinib rather than a TNFi to result in one additional event. ‡HRs (95% CIs) based on a simple Cox proportional hazard model for pairwise treatment comparisons, with treatment as covariate. BID, two times per day; HR, hazard ratio; IR, incidence rate; N, number of evaluable patients; n, number of patients with events; PY, patient-years; SIE, serious infection event; TNFi, tumour necrosis factor inhibitors.

