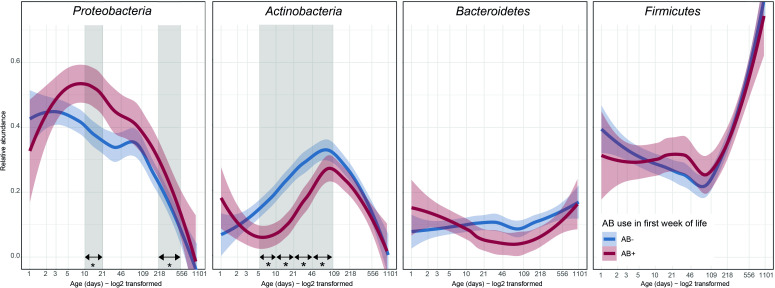
Figure 2.
Temporal trajectories of the relative abundance of the four main phyla in the developing intestinal microbiota from birth to 2.5 years of age. Thick lines represent the average with shading showing the 95% CI. Differences between AB+ and AB- were calculated using beta regression for each age category. * and vertical grey shading: difference in relative abundance (p<0.05), AB+, infants who received AB during their first week of life, AB-, infants who did not receive AB during their first week of life, LOESS, locally estimated scatterplot smoothing.

