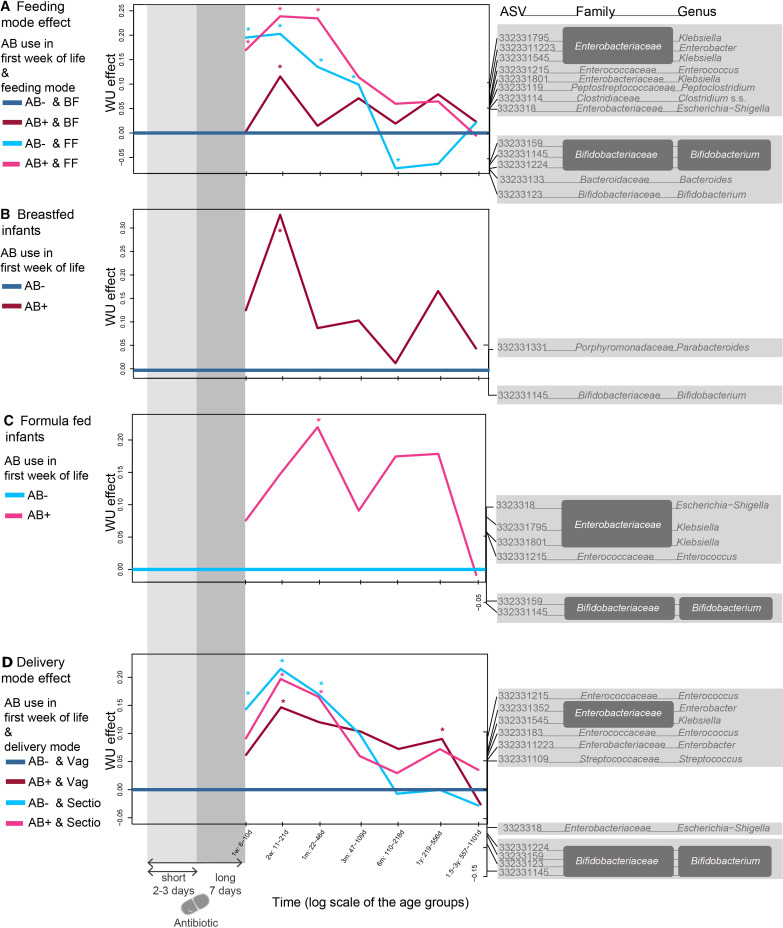
Figure 4.
WU-based PRC analyses in the different delivery and feeding mode groups. Bacterial genera shown are the main drivers for differences between the groups and the baseline: positive effect on the curve is linked to increased ASVs in the positive spectrum and decrease of those in the negative spectrum. (A) Breastfed controls (AB-BF) were compared as a baseline to antibiotic exposed (AB+) and FF infants. (B) Specifically featuring the AB effect in breastfed children, with breastfed control children as a baseline (AB-BF) and (C) formula-fed children, with formula-fed control children as a baseline (AB-). (D) Vaginally delivered control infants (AB-Vag) were compared as a baseline to antibiotic exposed (AB+) and C-section delivered (Sectio) infants. Significance was tested at the different time points using an ANOVA like permutation test (*p<0.05). Delivery mode analyses were controlled for feeding mode and vice versa. AB-, infants who did not receive AB during their first week of life; AB+, infants who received AB during their first week of life also indicated within grey shading; ASV, amplicon sequence variants; BF, infants exclusively breast-fed in the first 3 months of life; FF, infants exclusively formula-fed in the first 3 months of life; PRC, principal response curve; Sectio, infants delivered through C-section, Vag, vaginally delivered infants; WU, weighted UniFrac.

