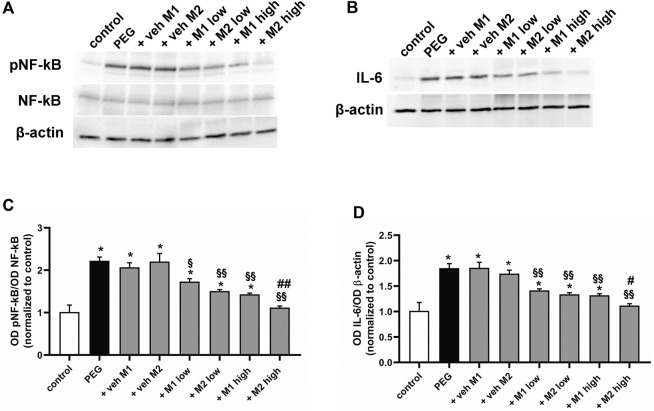
FIGURE 2.
Effect of M1 and M2 on inflammatory markers. Representative Western blots (A,B) and densitometric analysis of pNF-kB/NF-kB ratio (C) and IL-6 (D) in controls, PEG-injected untreated, PEG-injected treated with M1 or M2 vehicles, PEG-injected treated with low or high dose of M1 as well as with low or high-dose of M2. β-actin was used as loading control. Data are plotted as mean ± SEM. Differences among groups were assessed using one-way ANOVA followed by Tukey’s multiple comparison post-hoc test (N = 6). *p < 0.001 vs. control; § p < 0.01 and §§ p < 0.001 vs. respective vehicle; # p < 0.05, ## p < 0.01 vs. M1 high.

