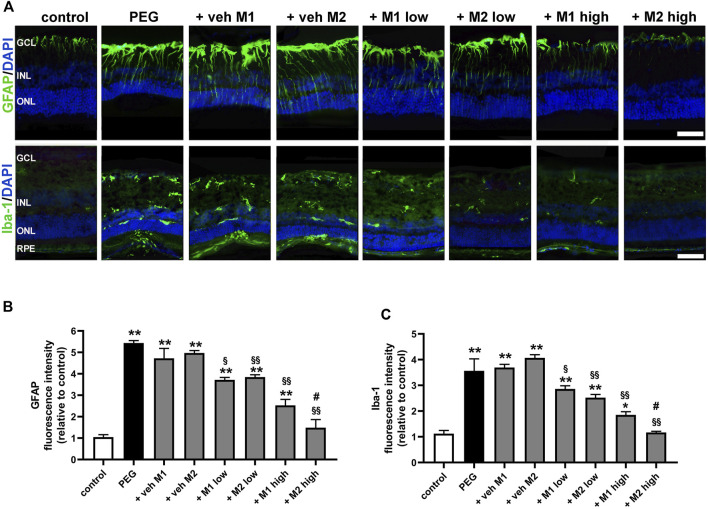
FIGURE 4.
Effect of M1 and M2 on Müller cells gliosis and microglial reactivity in the site of lesion. (A) Representative images of retinal cross sections immunolabeled for GFAP or Iba1 in controls, PEG-injected untreated, PEG-injected treated with M1 or M2 vehicles, PEG-injected treated with low or high dose of M1 as well as with low or high-dose of M2. Scale bar, 50 μm. GCL, ganglion cell layer; INL, inner nuclear layer; ONL, outer nuclear layer; RPE, retinal pigment epithelium. Quantitative analysis of GFAP (B) and Iba1 (C) immunofluorescence intensity. Data are plotted as mean ± SEM. Differences among groups were assessed using one-way ANOVA followed by Tukey’s multiple comparison post-hoc test (N = 6). *p < 0.01 and **p < 0.001 vs. control; § p < 0.01, §§ p < 0.001 vs. respective vehice; #p < 0.05 vs. M1 high.

