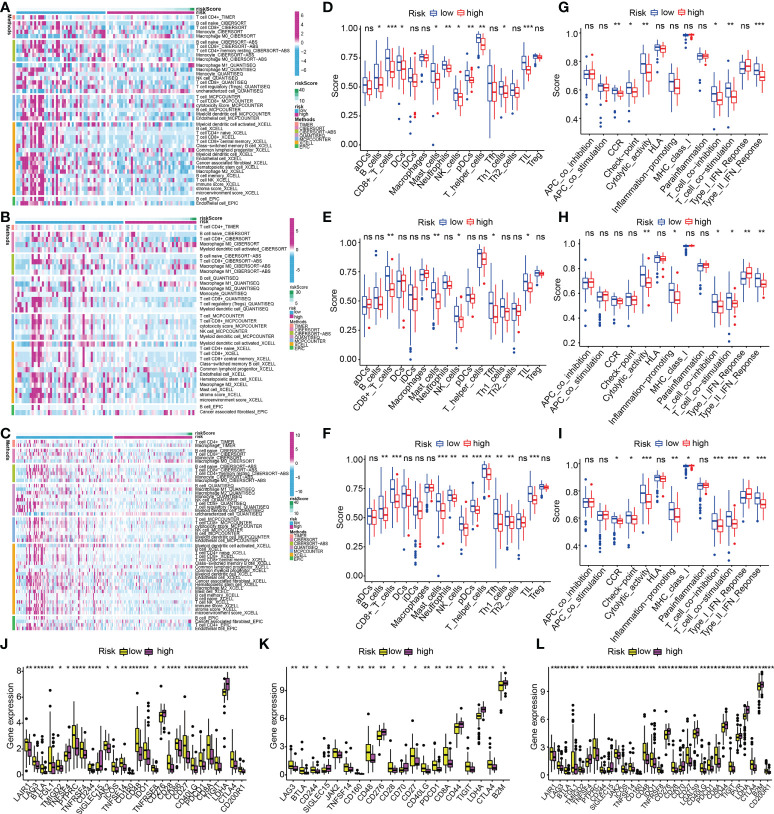
Figure 13.
ECM-APP-based analysis of tumor immune microenvironment. (A–C) The heat maps showed discrepancies in infiltration levels of immune cells across low- and high-risk subgroups premised on the train, test1, and test2 cohorts. The box plots showed discrepancies in ssGSEA scores between two risk subgroups in the (D, G) train cohort, (E, H) test1, and (F, I) test2cohorts. (J–L) The box plots showed discrepancies in immune checkpoint expression in low- and high-risk subgroups premised on the train, test1, and test2 cohorts. (* indicates p <0.05; ** indicates p < 0.01; *** indicates p < 0.001. ns, non-significant).

