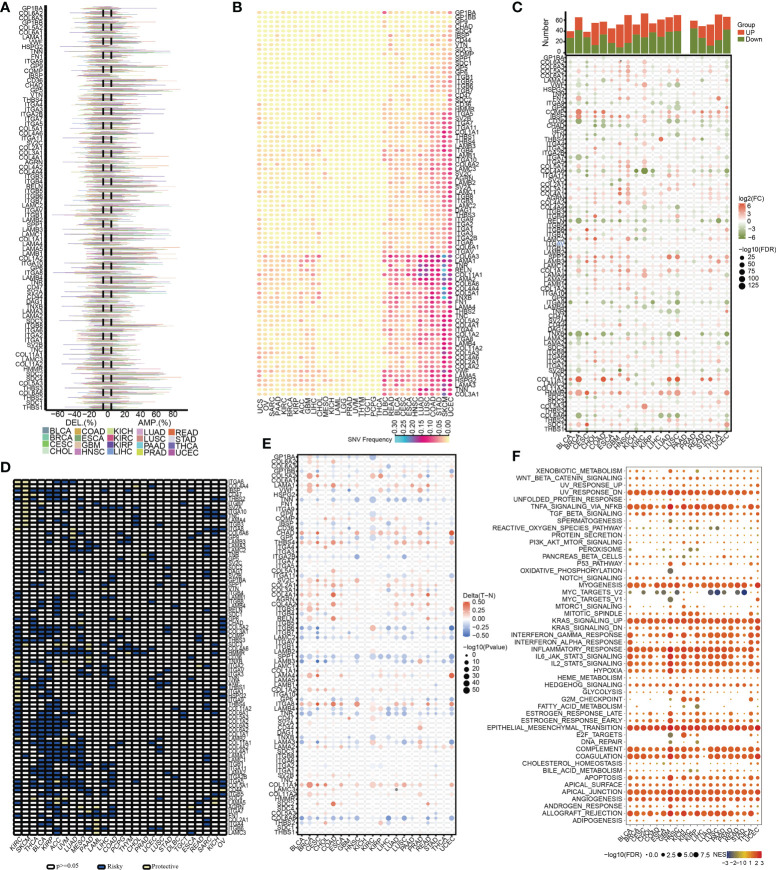
Figure 2.
The pan-cancer landscape of ECM receptor interaction-related genes. (A) CNV gain and loss frequency data across cancer types. The length of the line represents the variation frequency of the ECM-related genes in pan-cancers. (B) SNV data across cancer types. The mutant frequencies of ECM-related genes in pan-cancers (red color to green color represents low to high). (C) Gene expressions of the ECM-associated genes between tumor and neighboring normal tissues in pan-cancers (P<0.05). (D) Survival landscape of the ECM-related genes among all the types of cancers. The white color represents genes with P > 0.05, and the blue and yellow colors represent risk and protective genes, respectively. (E) The DNA methylation of ECMGs in different tumors (red color to blue color signifies high to low). (F) The relationship between cancer signaling and ECMGs (red color to blue color signifies high to low).

