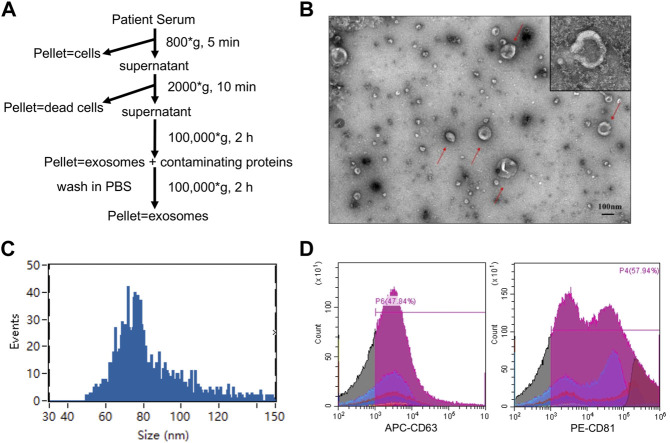
FIGURE 2.
Characterization of EVs. (A)The procedures for EVs isolation used in this study. (B) Morphological characterization of EVs isolated from serum by transmission electron microscopy. Typical EVs were amplified with red arrows. Scale bar = 100 nm (upper). (C) Average size distribution of EVs was revealed by nanoparticle tracking analysis. (D) EVs protein markers (CD 63 and CD 81) were identified by flow cytometry.

