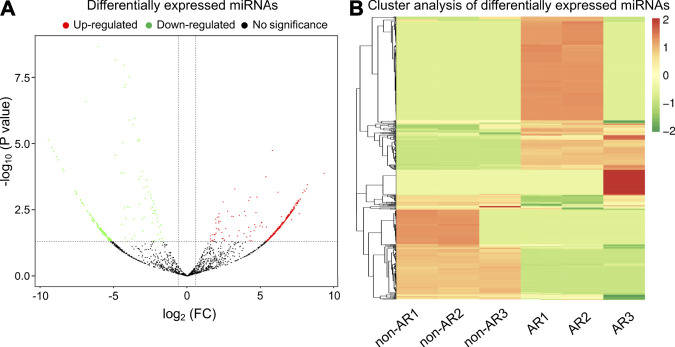
FIGURE 4.
Volcano plot and heat map of differential expressed miRNAs obtained from the comparison of non-AR and AR patients. (A) Each point in the volcano plot represents one miRNA. Red points represent upregulated ones, green points represent downregulated ones, and dark points represent no significant changes in miRNAs. (B) The abscissa represents different groups, the ordinate represents the different miRNAs compared in the groups, and the color blocks at different positions represent the relative miRNA expressions.

