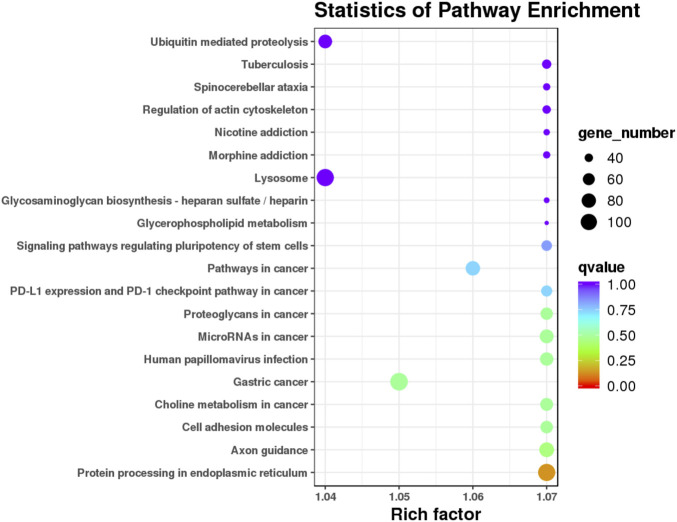
FIGURE 6.
KEGG pathway analysis of the target genes of known differential expressed miRNAs in AR patients compared with non-AR patients. Horizontal axis: Rich factor. The larger the point, the higher the enrichment degree, the more candidate target genes in this pathway, and the color of the point correspond to a different q value range. Vertical axis: The definition of the pathway.

