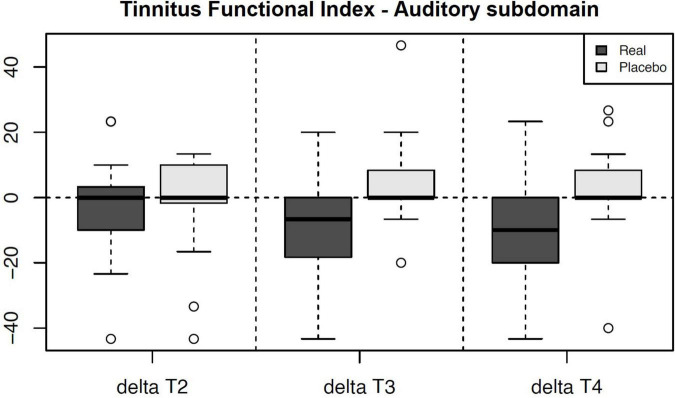
FIGURE 3.
Chart depicting the outcome changes in the Auditory subdomain of Tinnitus Functional Index compared to the T1 baseline and their side-by-side comparison between the arms. The results in T3 and T4 are statistically significant a denote a decrease (improvement) in the Auditory subdomain of the active group. Note – Real = Active Group, Placebo = Sham Group.

