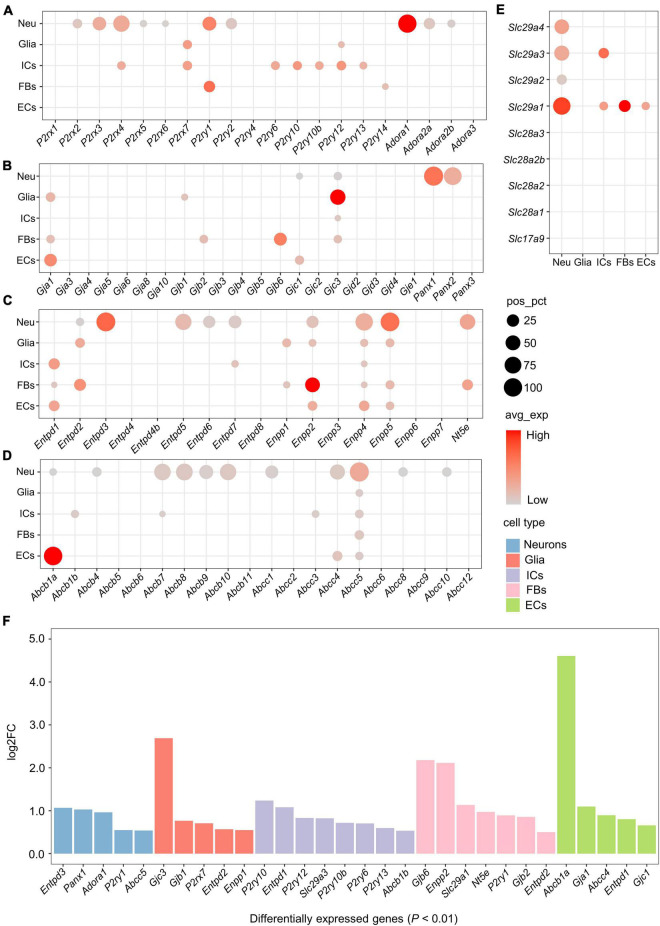
FIGURE 2.
Expression of genes associated with purinergic signaling in distinct cell types. (A–E) Bubble plot showing expression of genes encoding purinergic receptors, ATP release channels, ATP metabolism-associated enzymes or ATP/adenosine transporters in the 5 cell types. Bubble size represents the percentage of cells with positive expression (pos_pct), and bubble color represents average normalized expression levels (avg_exp). (Bubbles with pos_pct < 5% are not shown). (F) Bar plot showing significant differences in the expression of genes associated with purinergic signaling among 5 cell types (Wilcoxon Rank Sum test; P < 0.01 was considered statistically significant). The bars are color-coded by cell types, and the bar height represents log2 fold change (log2FC). Genes with log2FC > 0.5 and P < 0.01 are considered to have significantly higher expression.

