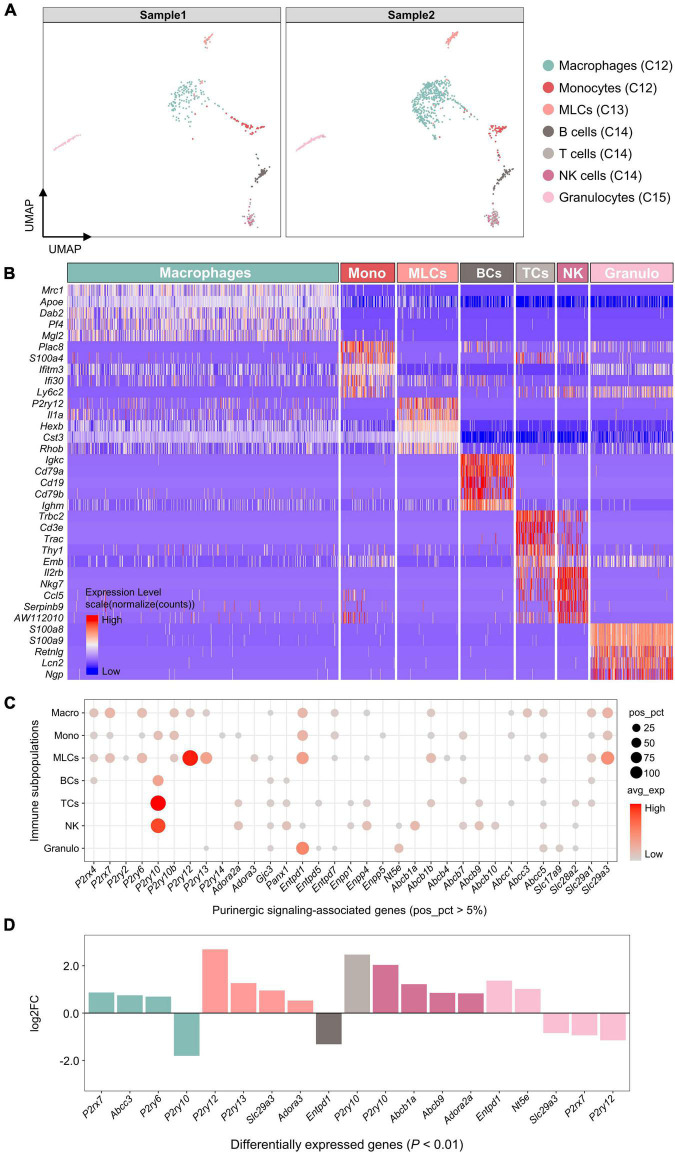
FIGURE 6.
Expression of genes associated with purinergic signaling in immune cell subpopulations. (A) UMAP plot showing SingleR automatic annotations. Each dot represents one cell. Cells are colored by SingleR annotations. (B) Heatmap showing expression of top 5 marker genes for each immune cell subpopulation annotated by SingleR. Heatmap colors represent relative expression levels. Red represents high expression and blue low expression. Immune cell subpopulations were color-coded above the heatmap. (C) Bubble plot showing expression of purinergic signaling-associated genes in immune cell subpopulations. (D) Bar plot showing differential expression of these genes among immune cell subpopulations (Wilcoxon Rank Sum test; P < 0.01 was considered statistically significant). Genes with log2FC > 0.5 and P < 0.01 are shown.

