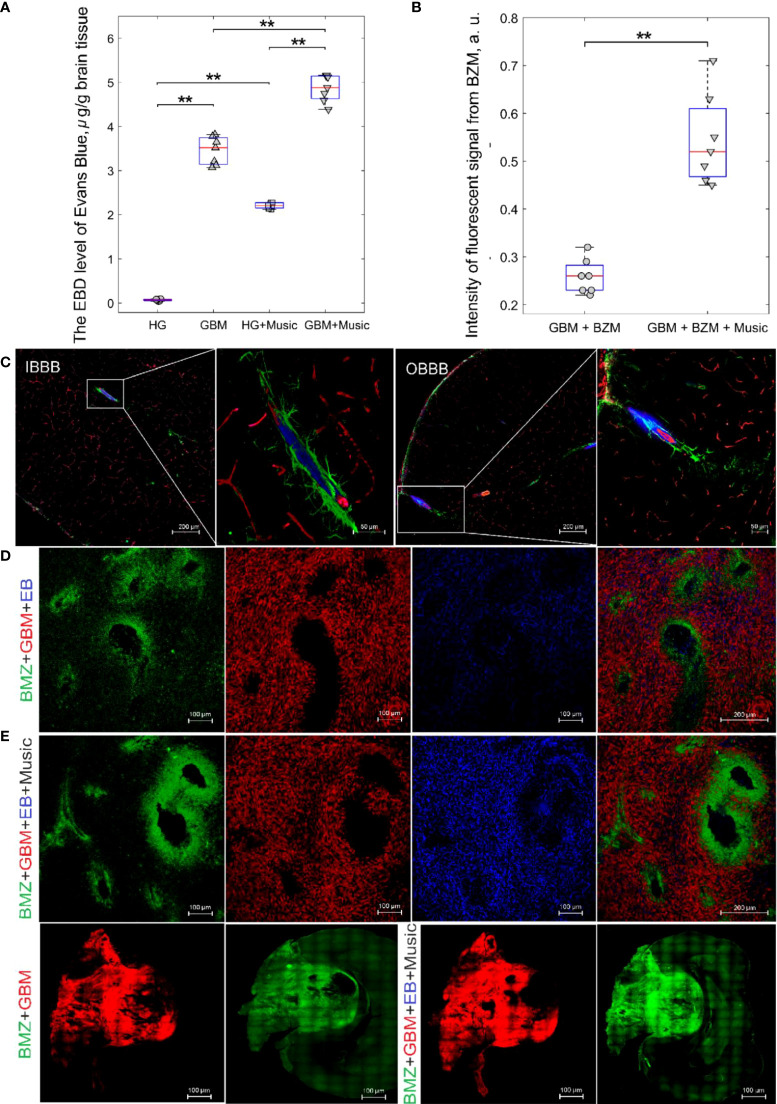
Figure 2.
The music-induced BBB opening for EBAC and FITC-BZM in rats: (A) the EBAC quantitation before and after music impact in the HG, HG+Music, GBM, GBM+Music groups, ** - p<0.01, the Mann–Whitney–Wilcoxon test, n=7 in each group; (B) Quantification of the intensity of the fluorescent signal from BZM in the GBM+BZM group and the GBM+BZM+Music group, ** - p<0.01, the Mann–Whitney–Wilcoxon test, n=7 in each group; (C) Confocal imaging of music-induced BBB opening for EBAC (blue) using the markers of pericytes (NG2, red) and astocytes (GFAP, green) in rats from HG group, the intact BBB (IBBB) and the opened BBB (OBBB); (D) Representative confocal images of distribution of BZM (green) in GBM (red) tissues of rats from the GBM+BZM and the GBM+BZM+Music groups; (E) - a whole section of brain imaging from the BZM+GBM and the BZM+GBM+Music groups.

