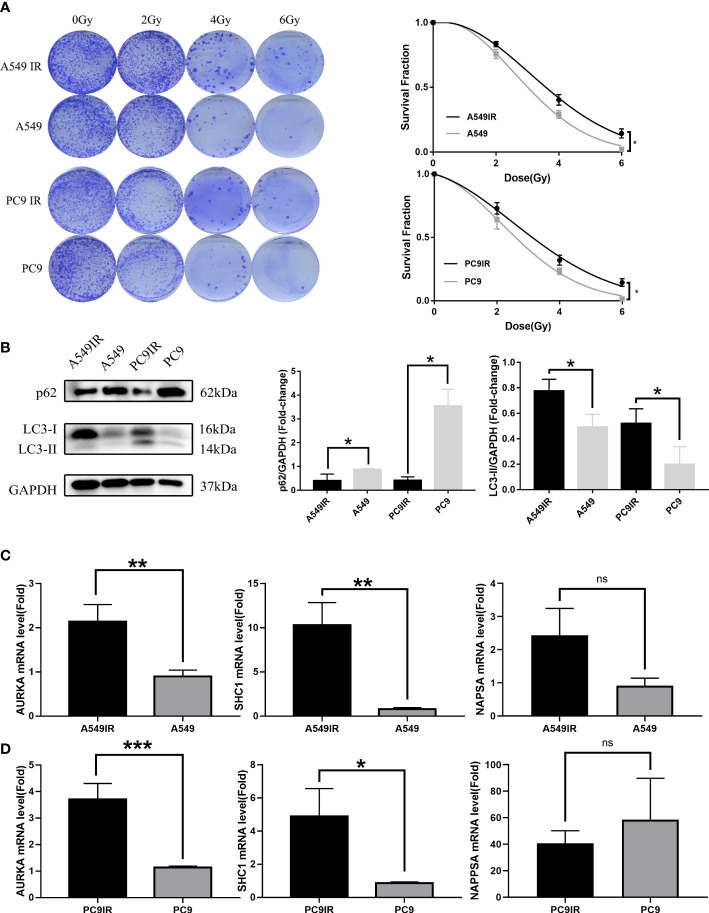
Figure 10.
Validation of the relationship between AURKA, SHC1, and NAPSA genes and radiotherapy sensitivity, and autophagy by constructing resistant cell lines compared with primary cells. (A) Colony formation assay reveal constructed resistance cells with enhanced radioresistance. (B) The western blotting assay showed increased levels of resistant cell autophagy. (C, D) Quantitative Real-time PCR verified significant differences in radiotherapy autophagy-related genes (AURKA, SHC1) between radiotherapy-resistant and primary cells. *p < 0.05, **p < 0.01, and ***p < 0.001. "ns" indicates P value ≥ 0.05, not statistically significant.

