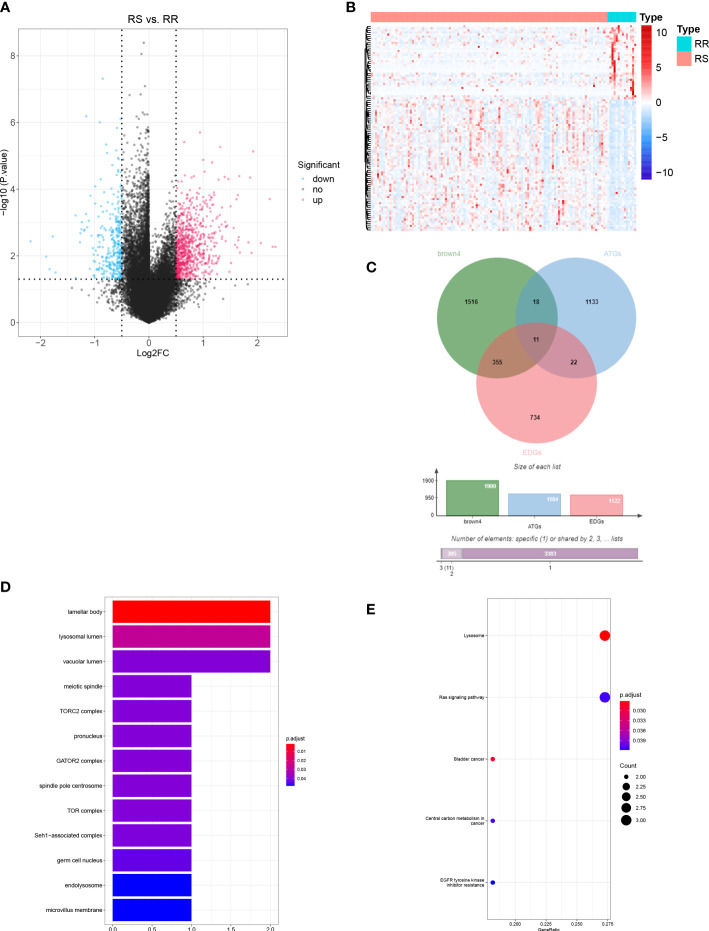
Figure 3.
Identification of DERRAGs in LUAD. (A) Volcano map of RS vs. RR differentially expressed genes (DEGs) in LUAD. (B) Heat map of RS vs. RR DEGs in LUAD (Top 100). (C) The Venn diagram of DEGs, ATGs, and key module genes (brown4). (D) GO enrichment analysis of DERRAGs. (E) KEGG enrichment analysis of DERRAGs.

