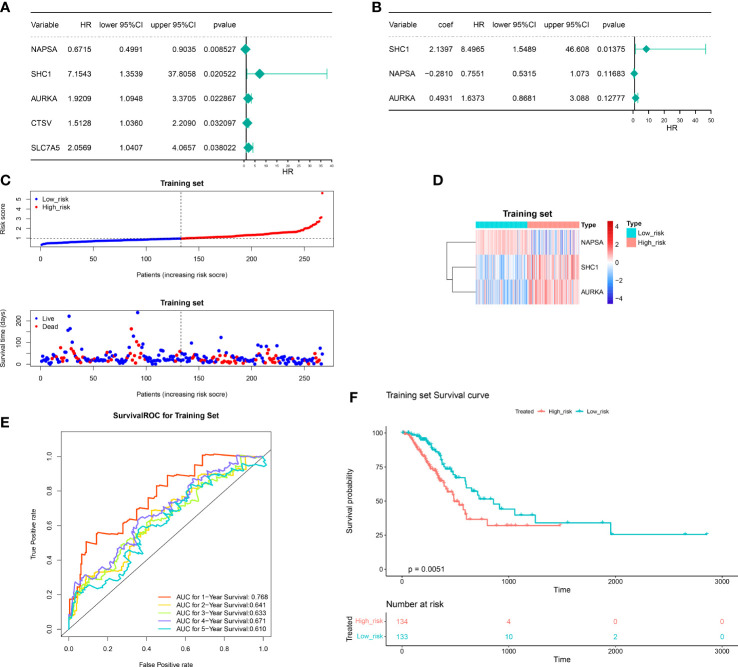
Figure 4.
Construction of the autophagy-related risk score model. (A) Univariate forest plot of the correlation between the expression of DERRAGs and the overall survival of LUAD patients. (B) Multifactorial forest plot of the correlation between expression of DERRAGs and overall survival of LUAD patients. (C) The validation set high and low-risk group curves. (D) Heat map of model gene expression in the high and low-risk groups in the training set. (E) Training set survival ROC curve. (F) KM survival curves for the high and low-risk groups in the training set.

