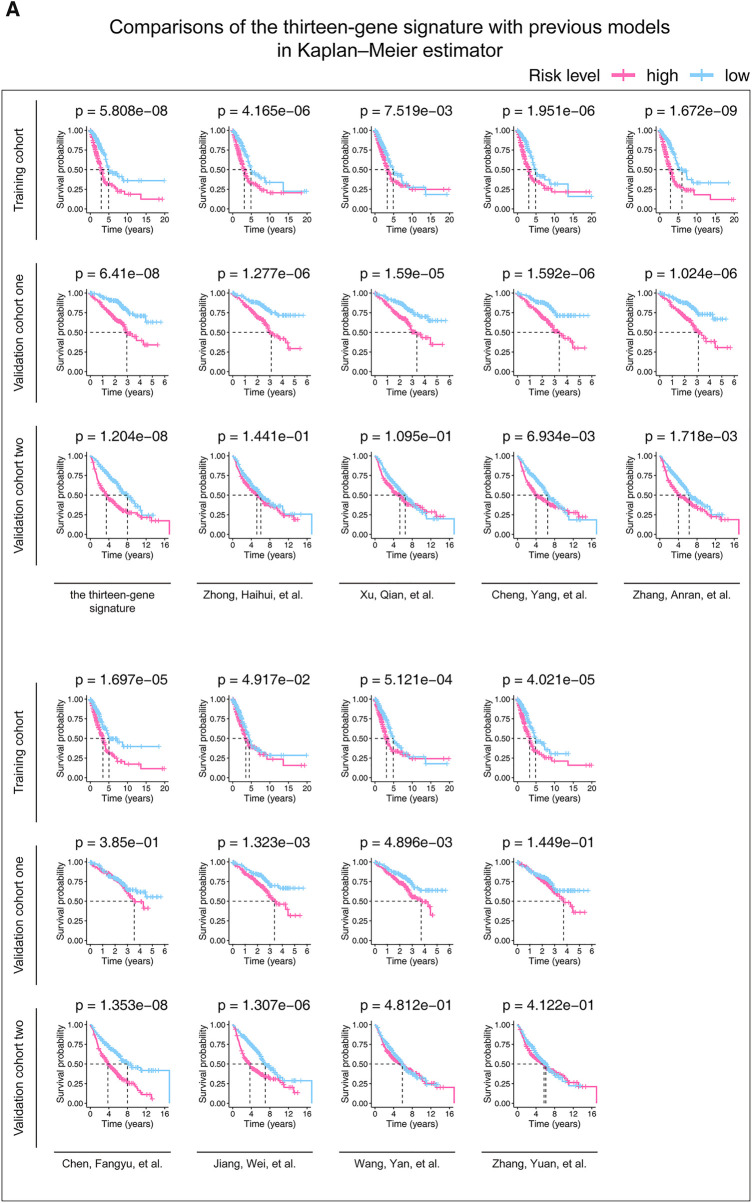
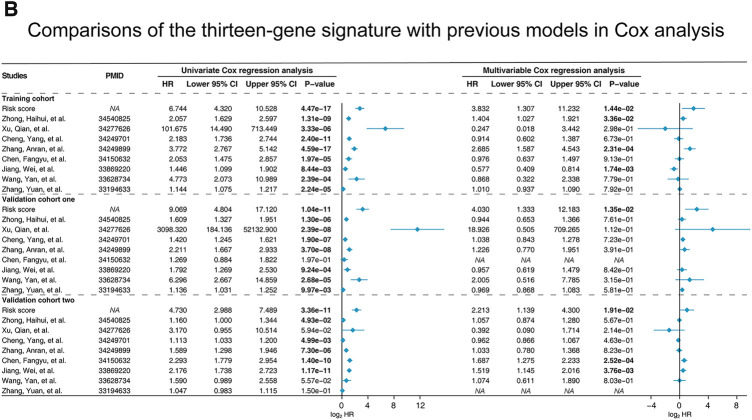
Figure 4.
Kaplan-Meier analysis (A) and Cox models (B) were performed in the studied cohorts to compare our and previous studies’ predictive abilities. (A) Patients in each cohort were divided into low-risk groups and high-risk groups based on their median risk score. The log-rank test with a p-value < 0.05 suggests the survival difference is significant. (B) Only univariate variables with p-values less than 0.1 were included in the multivariable analysis. The bold words mean the p-value < 0.05. P-value is considered significantly. HR, hazard ratio; CI, confidence interval; PMID, PubMed ID, https://pubmed.ncbi.nlm.nih.gov/.


