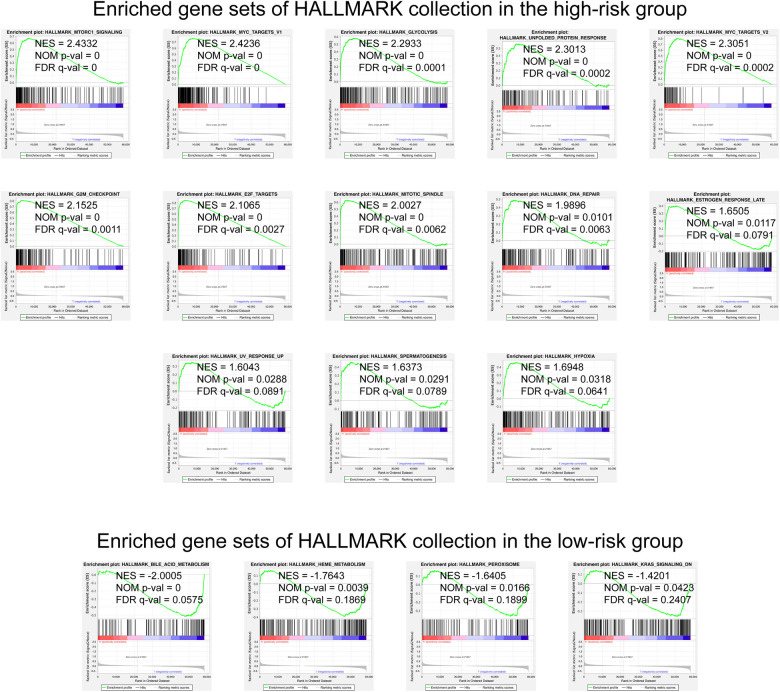
Figure 5.
GSEA analysis with the HALLMARK gene set as the background identified relevant pathways of our signature. The significance threshold of this analysis was set as: | NES | >1, NOM p-value < 0.05, and FDR q-value < 0.25. GSEA, Gene Set Enrichment Analysis; NES, Normalized Enrichment Score; NOM, Nominal; FDR, False Discovery Rate.

