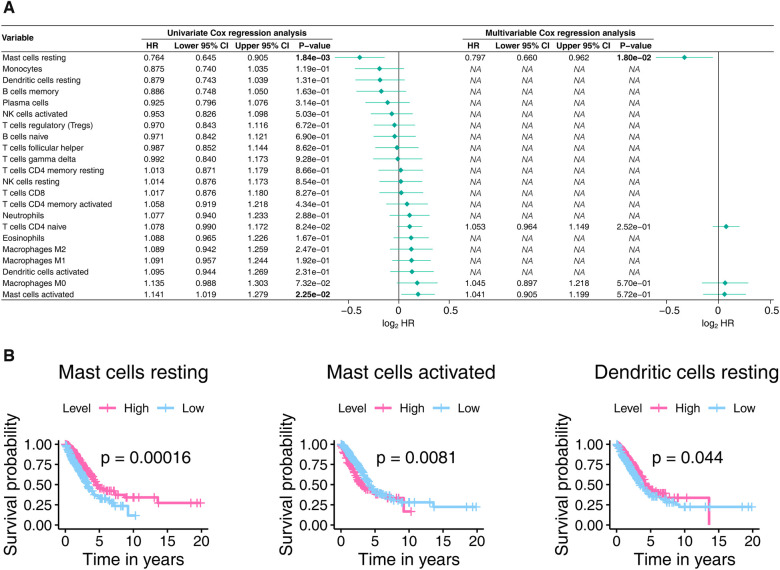
Figure 8.
The prognostic power of the 22 TICs was determined using the Cox proportional hazards model (A) and the Kaplan-Meier estimator (B). In Panel A, only univariate variables with p-values less than 0.1 were included in the multivariable analysis, with bold text indicating p-values < 0.05. In Panel B, we only show Kaplan-Meier plots with p-values less than 0.05. TIC, tumor-infiltrating immune cell; p-value < 0.05 is considered significant.

