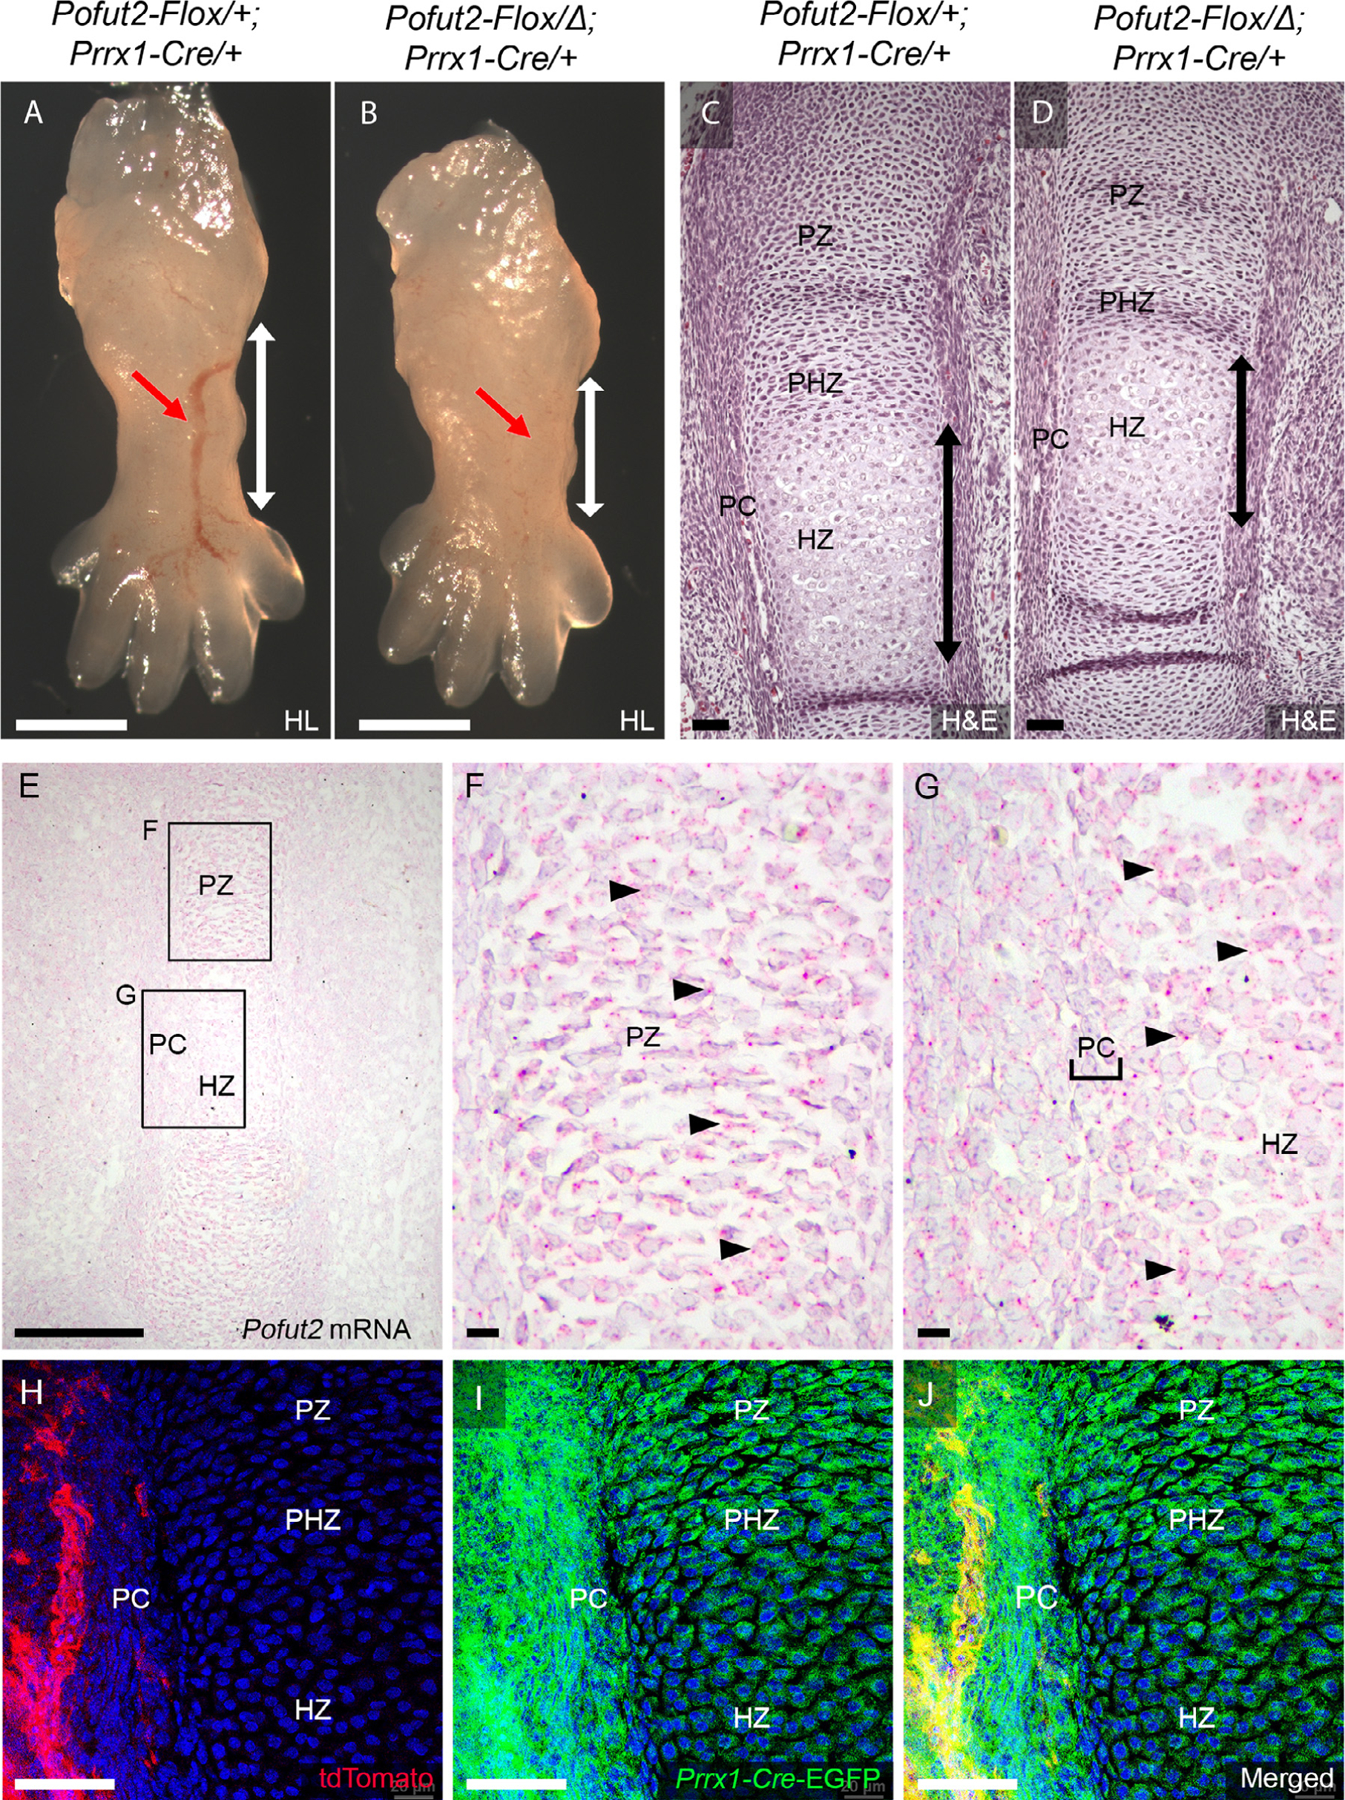
Figure 2. Loss of POFUT2 in developing limb mesenchyme caused significant shortening of limbs at E14.5.

(A-D) Representative images comparing wholemount (A,B) and Hematoxylin and Eosin stained sections (C,D) from E14.5 hind limb (HL) of control (Pofut2-Flox/+;Prrx1-Cre/+) (A,C) and Prrx1-Pofut2 mutant (Pofut2-Flox/Δ;Prrx1-Cre) (B, D). Red arrows in A and B indicate developing blood vessels. White vertical arrows in A and B indicate tibia region. Black vertical arrows in C and D indicate the extent of the hypertrophic zone. (E-G) Analysis of Pofut2 mRNA expression at E14.5 using RNAscope ®. Pofut2 mRNA appears as red dots (arrowheads) overlying cells counterstained with hematoxylin (purple). Rectangles in panel E indicate tibia regions magnified in panels F and G. Pofut2 transcripts were present throughout the proliferating zone (PZ) (F) and in the perichondrium (PC) (indicated by brackets) and hypertrophic zone (HZ) cells (G). (H-J) Assessment of Cre-mediated recombination in E14.5 embryo limb buds isolated from ROSA26mTmG reporter female mated to Prrx1-Cre/+ male mice. Limb section showing unrecombined tissues (tdTomato-red) outside the developing tibia (H), recombined reporter in developing tibia (EGFP-green) (I), and merged channels (J). Scale Bars: in panels A-B (1 mm), panels C-D (200 μm), panel E (500 μm), panels F-G (100 μm), H-J (50 μm).
