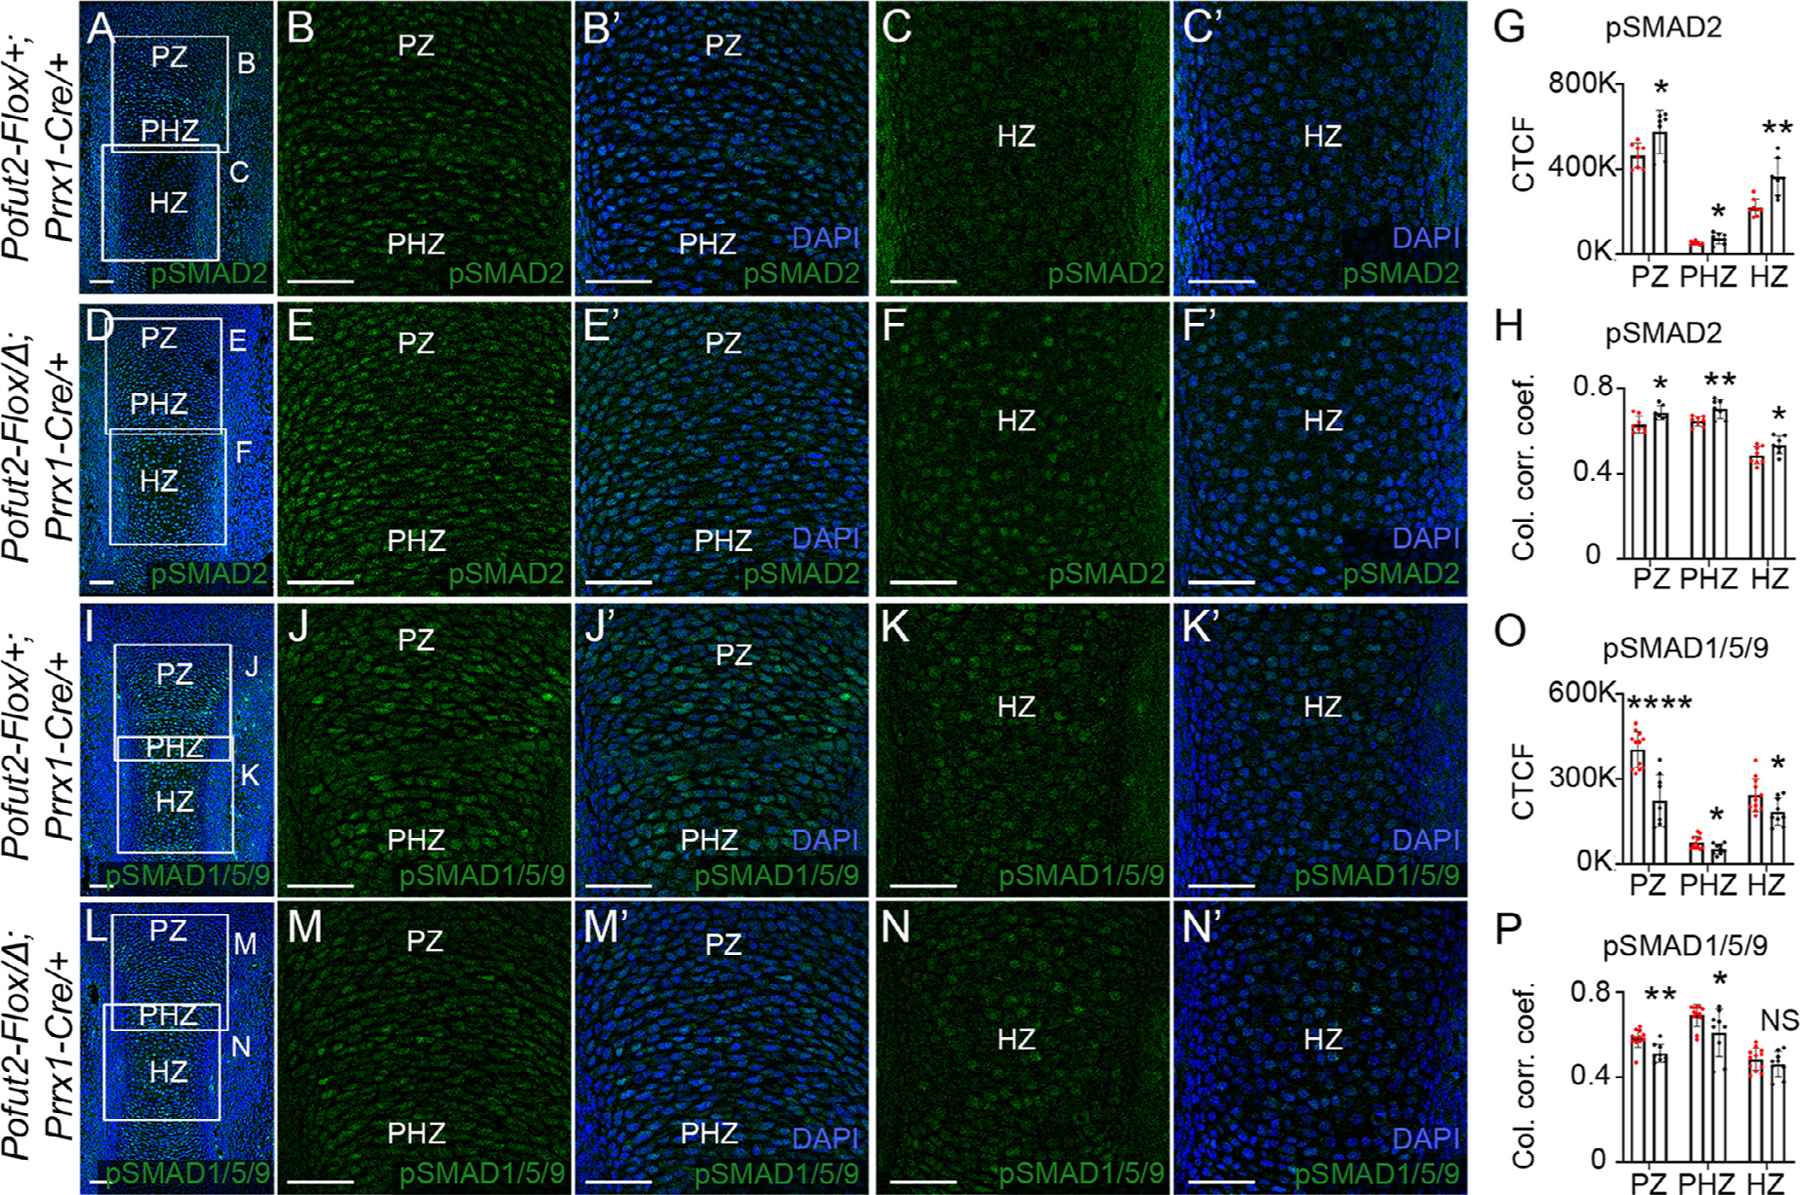
Figure 4. Elevated TGF-β and reduced BMP signaling in Pofut2 mutant tibia.

(A-F’) Representative maximum projection images of pSMAD2 (green) immunolocalization and DAPI (blue) in developing tibia from E14.5 control (Pofut2-Flox/+;Prrx1-Cre/+) (A-C’) and Prrx1-Pofut2 mutant (Pofut2-Flox/Δ;Prrx1-Cre) (D-F’) limbs. (A and D) Boxed regions in low magnification images indicate positions of higher magnification images showing proliferating (PZ) and prehypertrophic (PHZ) (B-B’, E-E’) and hypertrophopic (HZ) (C-C’, F-F’) zones. (G-H) Quantification of pSMAD2 immunofluorescence signals (G) and pSMAD2-DAPI nuclear colocalization by estimation of the colocalization correlation (corr.) coefficient (H) in the PZ, PHZ and HZ (see Figs. S7). (I-N’) Representative maximum projection images of pSMAD1/5/9 (green) immunolocalization and DAPI (blue) in the developing tibia from E14.5 control (I-K’) and Prrx1-Pofut2 mutant (L-N’) limbs. (I and L) Lower magnification images with boxed regions indicating position of higher magnification images showing the proliferative (PZ) and prehypertrophic (PHZ) (J-J’, M-M’) and hypertrophopic (HZ) (K-K’, N-N’) zones. (O-P) Quantification of pSMAD1/5/9 immunofluorescence signals (O) and pSMAD1/5/9-DAPI nuclear colocalization by estimation of the colocalization correlation (corr.) coefficient (P) in the PZ, PHZ and HZ regions. Analyses were performed using a single hind limb isolated from minimum of three embryos per genotype (n=3) with 2–4 sections per limb (Fig. S8). White squares indicate magnified regions of tibia sections. Data from control (red dots) and Prrx1-Pofut2 mutants (black dots) were evaluated for statistical significance using unpaired, two-tailed t-test: *p≤0.05, **p≤0.01, ****p≤0.0001, and NS; not significant (G, H, O and P). Scale bars: 50 μm.
