FIGURE 3.

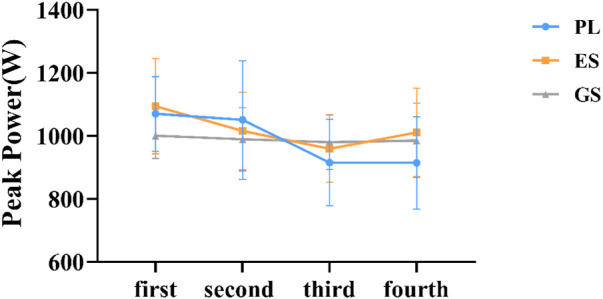
Trend of peak power. The horizontal coordinate represents the order of WACT in the experiment. The figure represents the mean ± SD of peak power data for three conditions.

Trend of peak power. The horizontal coordinate represents the order of WACT in the experiment. The figure represents the mean ± SD of peak power data for three conditions.