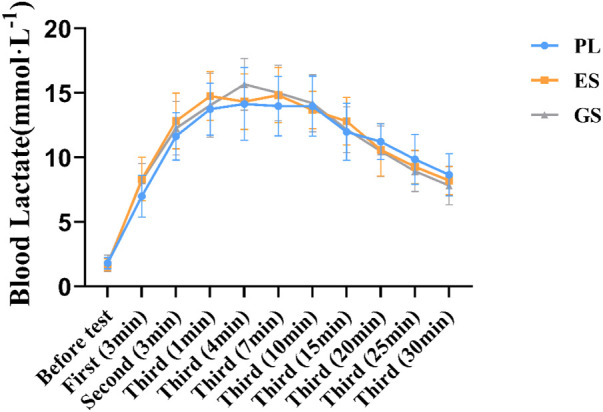
FIGURE 4.

Blood lactate responses during the experiments. Values are means ± SD. First (n min): n minutes after the first WACT; Second (n min): n minutes after the second WACT; Third (n min): n minutes after the third WACT.

Blood lactate responses during the experiments. Values are means ± SD. First (n min): n minutes after the first WACT; Second (n min): n minutes after the second WACT; Third (n min): n minutes after the third WACT.