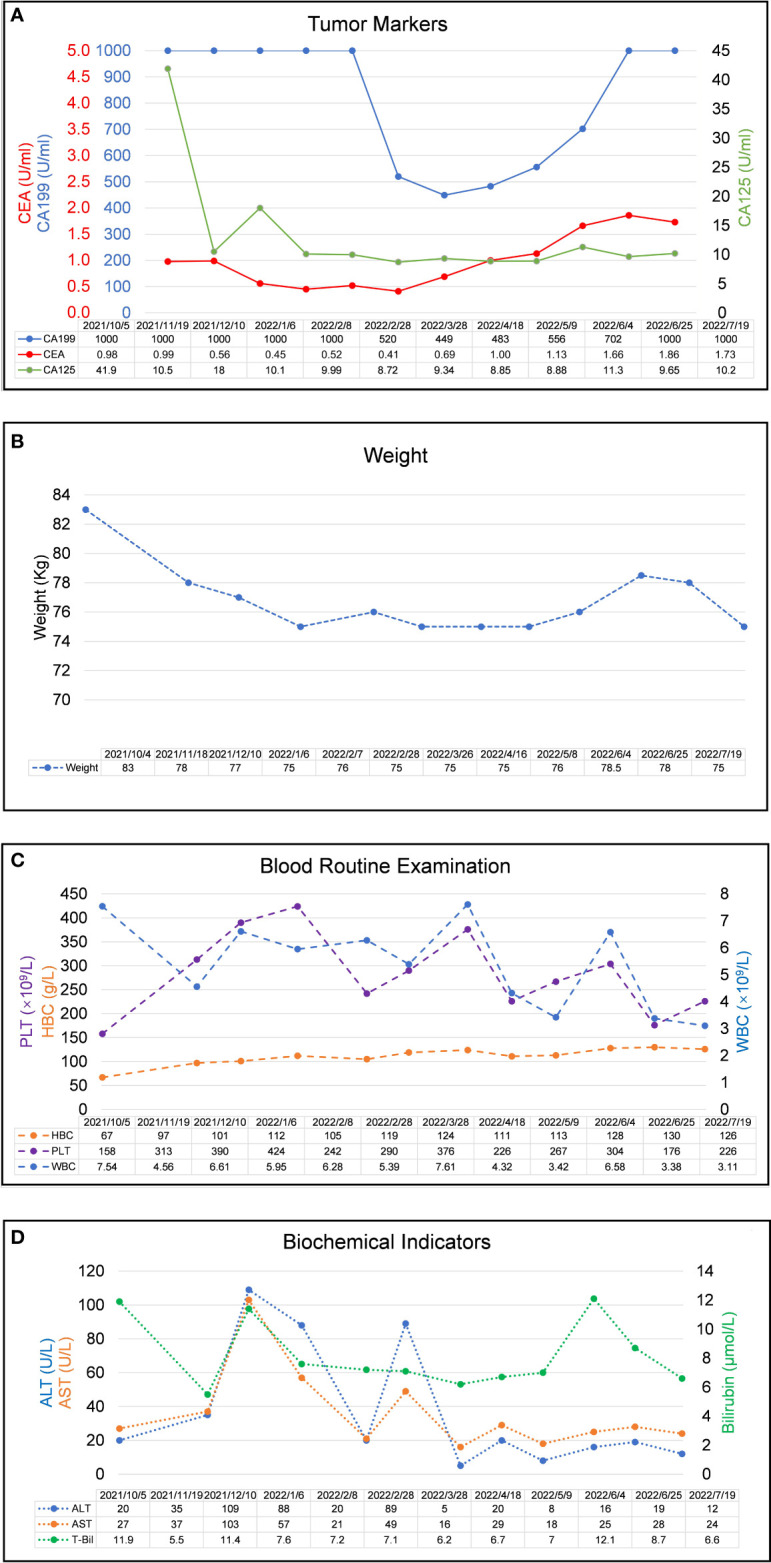
Figure 3.

Laboratory examination results during the clinical course. (A) Trends in the level of tumor markers, including CA 199, CA125, and CEA (right Y-axis) correspond to the treatment timeline. (B) Trends in the level of weight changes corresponding to the treatment timeline. (C). Trends in the level of blood routine examination, including PLT, HBC, and WBC (right Y-axis) correspond to the treatment timeline. (D) Trends in the level of biochemical indicators, including ALT, AST, and Bilirubin (right Y-axis) correspond to the treatment timeline. All X-axes show the date of disease progression. (CEA, carcinoembryonic antigen; CA199, carbohydrate antigen 19-9; CA125, carbohydrate antigen 125, WBC, white blood cell count; HBC, hemoglobin; PLT, blood platelet count, ALT, alanine aminotransferase; AST, aspartate aminotransferase).
