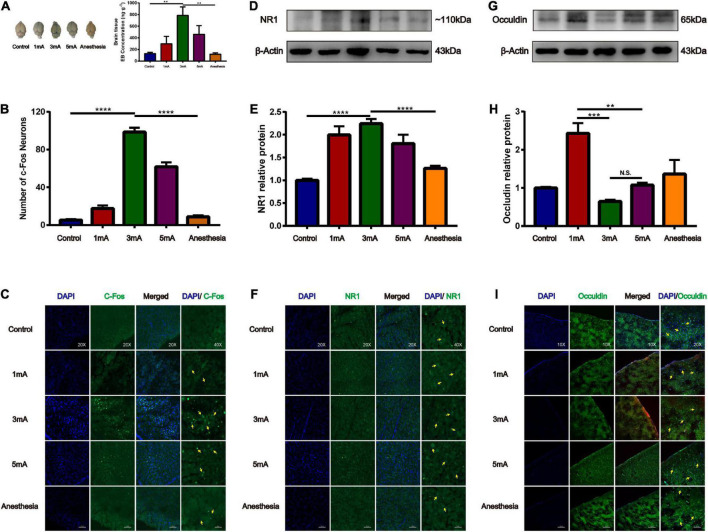
FIGURE 5.
Different intensities of EA of trigeminal nerve on promoting BBB opening and its effect on tight junction protein occludin. (A) Shows the degree of brain EB penetration after different intensities of EA of trigeminal nerve under naked eye observation. EB concentration in the cerebral cortex; **P < 0.01, EA 3 mA group vs. control group and anesthesia (based on EA 3 mA) group; n = 6/group. (B) Number of c-Fos Neurons in the frontal cerebral cortex, four slices from each individual rat used for average; ****P < 0.0001, EA 3 mA group vs. control group and anesthesia group; n = 4/group. (C) Different intensities of EA of the trigeminal nerve, EA 3 mA group shows the most significant c-Fos fluorescence expression (yellow arrows). (D,E) Compared to the control group, NR1 protein expression was increased in all the EA groups, but the increase was most significant in the EA 3 mA group, and NR1 protein expression was decreased after anesthesia, ***P < 0.001, EA 3 mA group vs. control group and anesthesia group, n = 6/group. (F) Cerebral cortex NR1 fluorescence expression. The 3 mA group had the most pronounced expression. (G,H) The EA 3 mA group occludin protein expression was significantly decreased and no significant change was observed after anesthesia. But the EA 1 mA group had significantly increased expression, ***P < 0.001, 1 mA group vs. 3 mA group, **P < 0.01, 1 mA group vs. 5 mA group, P > 0.05, 3 mA group vs. 5 mA group, n = 6/group. (I) The EA 3 mA group occludin protein fluorescence expression was complete, with continuity after anesthesia (yellow arrows).

