
FIGURE 1.
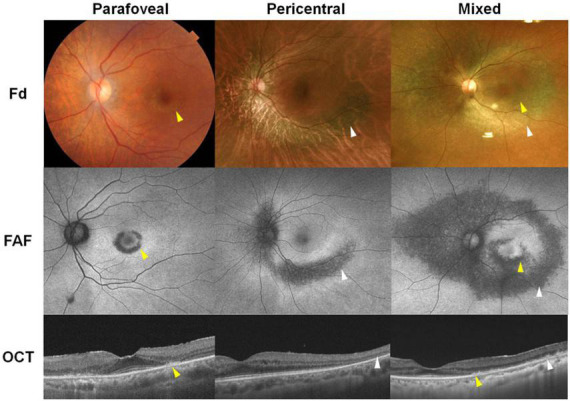
Representative images of hydroxychloroquine retinopathy in patients treated with hydroxychloroquine therapy (left: 200 mg/day for 21 years, middle: 200 mg/day for 20 years, right: 200 mg/day for 20 years). These cases demonstrate parafoveal, pericentral, and mixed (both) involvement on fundus examination (Fd), fundus autofluorescence (FAF), and optical coherence tomography (OCT) images. Yellow and white arrowheads indicate parafoveal and pericentral retinal damage, respectively.