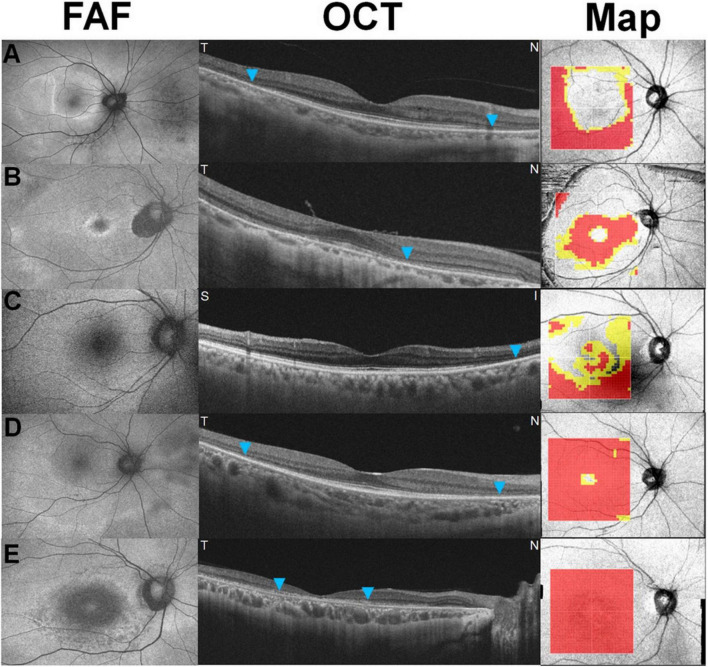
FIGURE 3.
Five recognizable patterns [a pericentral ring (A), parafoveal ring (B), mixed ring (C), central island (D), and whole macular thinning (E)] of retinal thinning in retinal thickness deviation maps on swept-source optical coherence tomography in eyes with hydroxychloroquine retinopathy. Yellow (representing a thickness of <5% of the normative level) or red pixels (representing a thickness of <1%) indicate retinal thinning [Reprinted with permission from Kim et al. (11)].

