Figure 6.
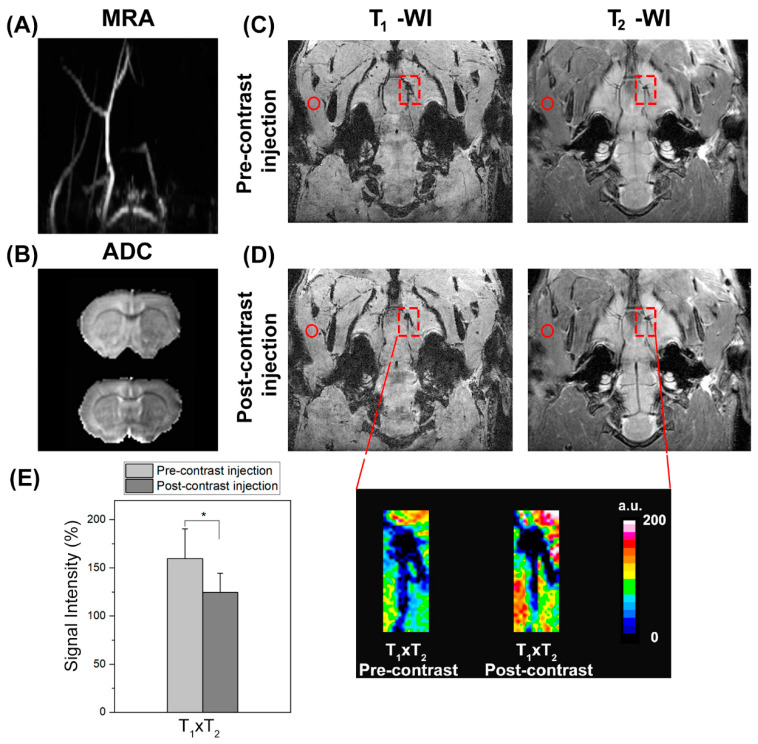
(A) Coronal intensity projection of TOF angiography showing right-sided flow deficit of rat brain due to an autologous clot (2 h incubation time). (B) Apparent diffusion coefficient (ADC) map at the same level showing a hypointense lesion in the MCA region. Coronal slice from T1- and T2-wis 3D at the level of the MCA origin pre- (C) and post-contrast (D) injection of KCREKA-NPs. The squares indicate the thrombus region, and the circles the adjacent muscle were used as reference for signal intensity calculations. (E) Corresponding T1 × T2 expanded reconstruction at the level of the MCA origin, revealing a significant signal intensity change in the presence of the occlusive thrombus after KCREKA-NP injection (* p < 0.05).

