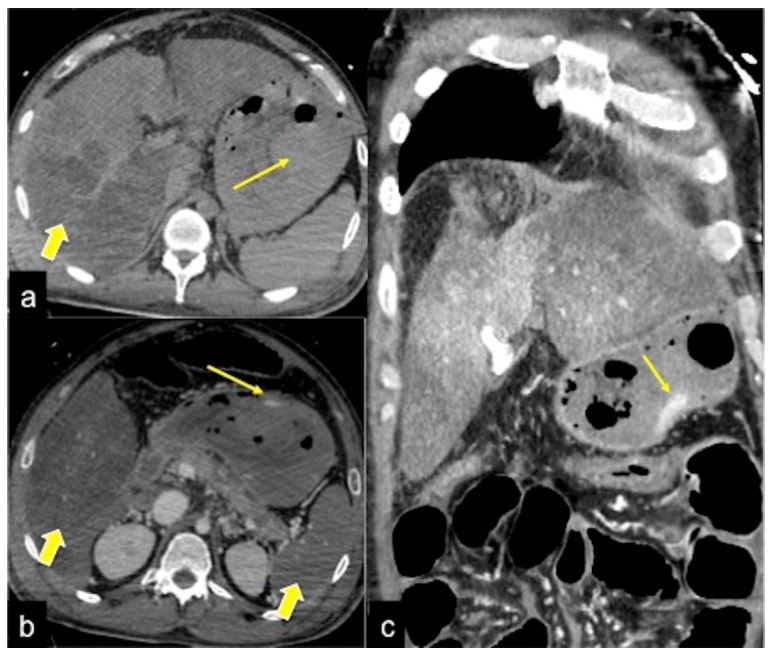
Figure 20.
CTA multiphasic study of gastric bleeding in hypopefusive complex. The pre-contrast phase (a) shows a gastric endoluminal area of spontaneous hyperdensity (long arrow) as a sentinel clot associated with alteration of liver density in the right lobe (large arrow). In the arterial phase (b) an active haemorrhagic focus in the stomach (long arrow) associated with hypo perfusion of the liver and splenic parenchyma (large arrows) are detected as signs of hypotensive general status. In the venous phase (c) there is an enlargement of the haemorrhagic blush (long arrow) with inhomogeneous liver perfusion.

