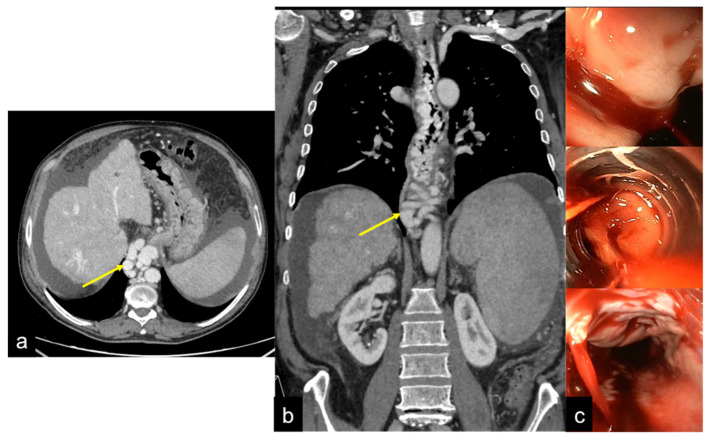
Figure 21.
Axial (a) and coronal (b) images of CTA multiphasic study with endoscopic corresponding images (c). In CT, the oesophageal varices in portal hypertension are visualised as tubular structures with an endoluminal protrusion in the oesophageal wall ((a,b) arrow); the endoscopic evaluation reveals signs of active bleeding (c).

