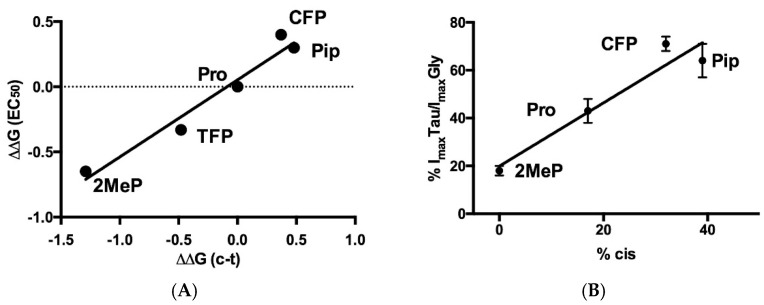
Figure 9.
(A) Relationship between EC50s and cis-trans preferences for Pro and analogues at position 146. All values are relative to Pro. R2 = 0.96, slope = significantly non zero p = 0.004. Cis-trans (c-t) values for Pip and CFP from Limapichat et al. [24], for TFP from Pandey et al. [25], and for 2MeP from Kang & Park [26]). (B) Relationship between maximal Tau /Gly induced responses (Figure 4) and % cis (from Limapichat et al. [24]); R2 = 0.92, slope = significantly non zero p = 0.04.

