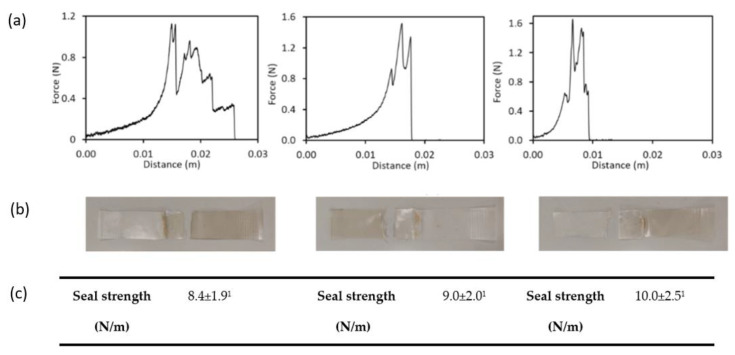
Figure 2.
Typical behavior of seal profile of the starch-polyester bilayer films at different storage times (t0, t1, and t2). (a) Force-distance curves. (b) Image of the sheet separation mode: delamination and (c) mean values and standard deviation of seal strength (N/m). Different superscript numbers indicate significant differences between the seal strength values at the three storage times (p < 0.05).

