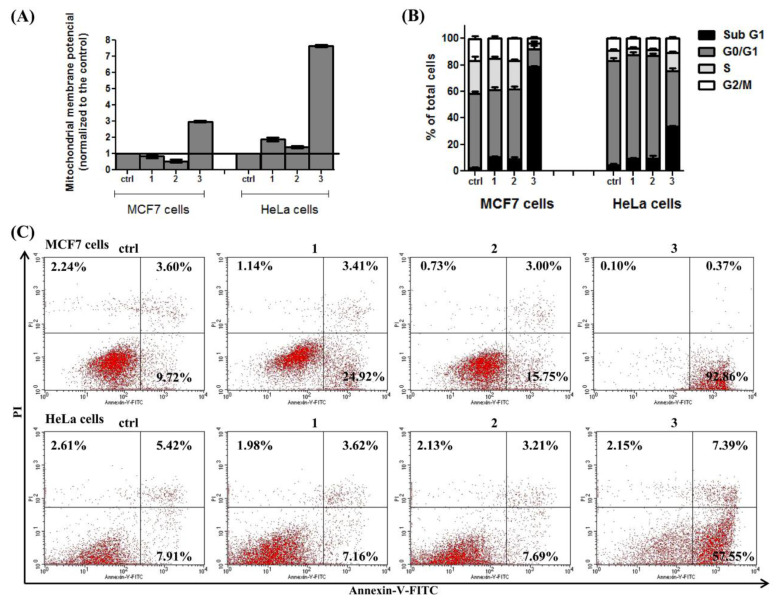
Figure 7.
Flow cytometry analysis of MCF-7 and HeLa cells after 48 h of treatment with IC50 concentrations of extracts and resveratrol: (A) mitochondrial membrane potential, normalized to the control; (B) cell cycle phase distribution expressed as % of total cell number; (C) apoptosis rates assessed by the Annexin V fluorescein isothiocyanate/propidium iodide kit. Ctrl—control; 1—dry extract; 2—subcritical water extract; 3—resveratrol.

