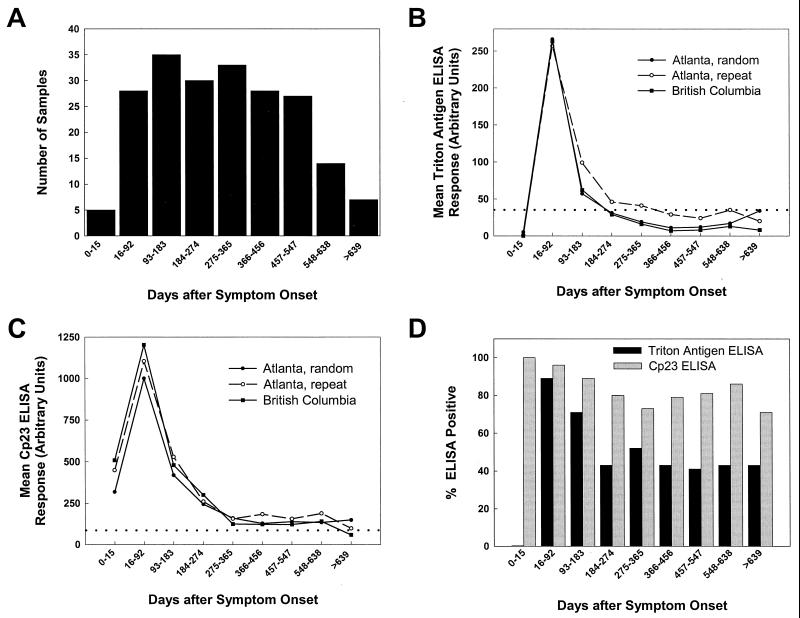
FIG. 4.
ELISA analysis of sera from cryptosporidiosis patients who donated sera on more than one occasion. Panel A shows the total number of serum samples collected during each time interval after symptom onset from 41 confirmed cryptosporidiosis patients who donated more than one specimen. Triton antigen (B) and Cp23 (C) ELISAs were performed with these serum samples on two occasions in Atlanta to assess the intralaboratory variation (Atlanta, random and Atlanta, repeat) and on one occasion in British Columbia to assess the interlaboratory variation (British Columbia). For the assays represented by the “Atlanta, random” results, the duplicate serum samples were placed in random locations on the ELISA plate to eliminate the possibility of positional bias. The geometric means (log scale) of the ELISA responses are plotted for each interval of sample collection, and the threshold for positivity is indicated in each graph by a dotted line. Panel D shows the fraction of the samples from each time interval positive for antibodies in the Triton antigen (black bars) and Cp23 (grey bars) ELISAs. A serum sample was considered ELISA positive if at least two of the responses from the three independent assays were above 35 AU for the Triton antigen assay and above 86 AU for the Cp23 assay.

