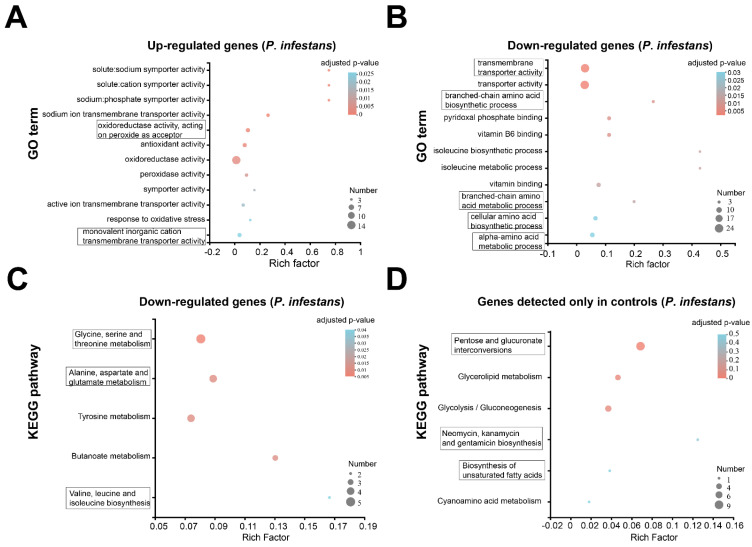
Figure 4.
GO and KEGG analysis for the transcriptomic data of P. infestans after MgO NP exposure. (A,B) GO enrichment analysis of DUGs (A) and DDGs (B), respectively. (C,D) KEGG pathway enrichment analysis of DUGs (C) and control-only expressed genes (D), respectively. Enriched GO terms or KEGG pathways are shown in a bubble diagram. The horizontal axis shows the Rich factor (the ratio between the number of concerned genes and the number of total transcription genes in the corresponding term). The vertical coordinates indicate the different GO terms or KEGG pathways. The size of the point shows that concerned gene numbers in corresponding GO term or KEGG pathways. The color of each bubble indicates the adjusted p-value.

