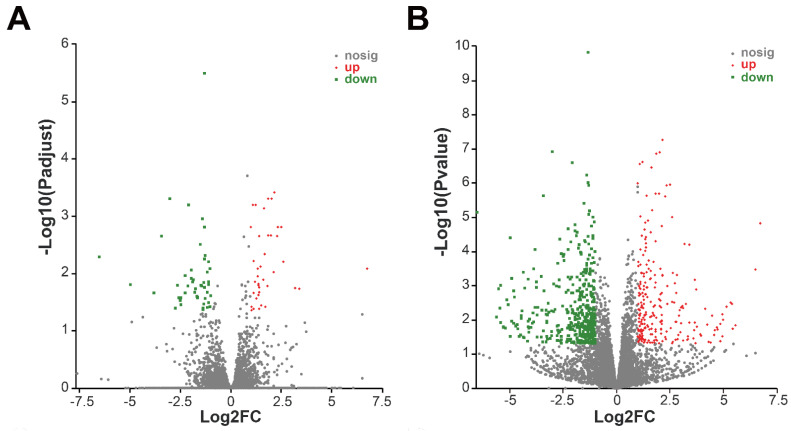
Figure 5.
Transcriptome profiles of potato after 6 h MgO NP exposure. (A) Volcano plot showing DEGs of potato after MgO NP exposure. The adjusted p-value < 0.05 and fold changes <0.5 or >2.0 were used as the cutoff. (B) Volcano plot showing DEGs of potato after MgO NP exposure. The p-value < 0.05 and fold changes <0.5 or >2.0 were used as cutoff. Red dots indicate up-regulated genes, and green dots indicate down-regulated genes, grey dots represent no significantly different expressed genes. The X-axis shows the fold-change values between the control and MgO NP exposure groups, based on a log2 scale, and the Y-axis shows the adjusted p-value or p-value of differentially expressed genes based on a log10 scale.

