Figure 1.
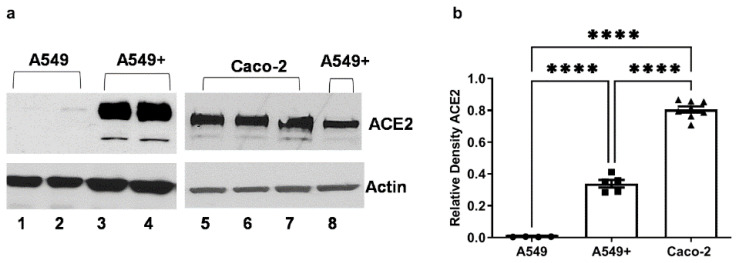
ACE2 receptor protein expression in A549, A549+, and Caco-2 cells in this study. The three cell lines utilized in this study were evaluated for ACE2 receptor protein expression using western blotting. A549 and A549+ human Type 2 lung alveolar cells and Caco-2 human intestinal epithelial cells were grown to 80% confluence in 12-well plates, and each lane (30 µg/lane) represented a separate well. Cells were lysed and analyzed with antibody to human ACE2 and densitometry analysis was conducted using ImageJ software (NIH). (a) Lanes 1–2 are native ATCC A549 cells; lanes 3–4 are A549+ ACE2 stable overexpressing cells; lanes 5–7 are lysates from human Caco-2 intestinal epithelial cells; lane 8 shows data from a single well of A549+ cells, with Caco-2 cell lysates for comparison on the same blot. (b) Relative ACE2 western blot densitometry data comparisons (each data point is mean ACE2 from a well) for the three cell types. A549, N = 4; A549+, N = 5; Caco-2, N = 8. The actual ImageJ mean density values for relative ACE2 protein (~120 kD) expression vs. actin (~45 kD) are for A549 mean 0.004207; A549+ mean 0.3384, and Caco-2 cells mean 0.8054. One-way ANOVA (F (2,14) = 410.6, p ˂ 0.001) was followed by Tukey’s multiple comparison test, as shown on the graph: **** p < 0.0001.

