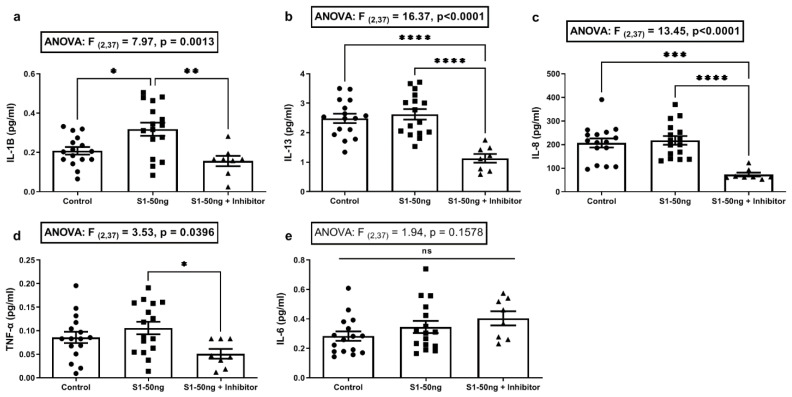
Figure 2.
Supernatant cytokine levels following stimulation of A549+ cells with 50 ng/mL S1 spike protein for 24 h. A549+ cells in 12-well plates at 80% confluence in 1 mL media were stimulated for 24 h with media alone (“Control”, left column), or 50 ng/mL (0.65 nM) of the SARS-CoV-2 spike S1 protein (“S1-50 ng”, middle column), or 50 ng/mL S1 plus 30µM PD98059 MEK1/2 MAPK ERK1/2 inhibitor for 24 h (“S1-50 ng + Inhibitor”, right column). Inhibitor was added 1 h before S1 stimulation and was not removed. Supernatant cytokines were measured using the Meso Scale platform (a–e). Control: N = 16/group, S1-50 ng: N = 16/group, S1-50 ng + Inhibitor: N = 8/group). One-way ANOVA results (indicated in box) along with Tukey’s multiple comparison tests are shown on the graph: * p < 0.05, ** p < 0.01, *** p < 0.001, **** p < 0.0001, ns = not significant (p > 0.05).

