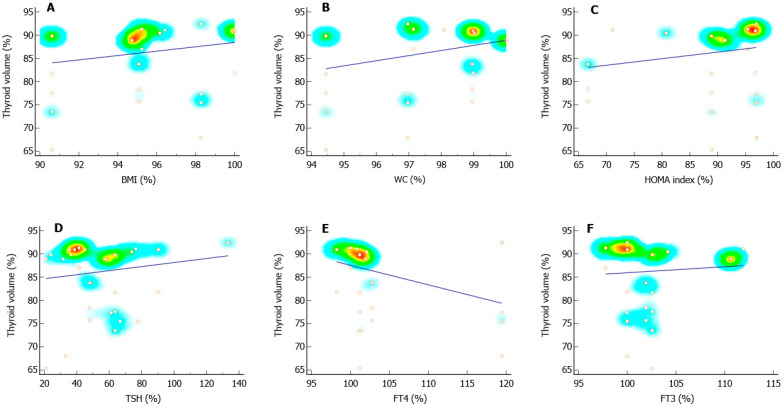
Figure 3.
Scatter plots and regression lines of the thyroid volume ratio. Panels (A–C) show the distribution and regression line of the thyroid volume ratio (%) and the ratio of the body mass index (BMI) (A), the waist circumference (B), and the homeostatic model assessment (HOMA) index (C). Panels (D–F) show the distribution and regression line of thyroid volume ratio (%) and the ratio of thyroid-stimulating hormone (TSH) (D), thyroxine (FT4) (E), and free-triiodothyronine (FT3) (F). The ratio of each variable was calculated using the following formula: [(after value/before value) × 100].

